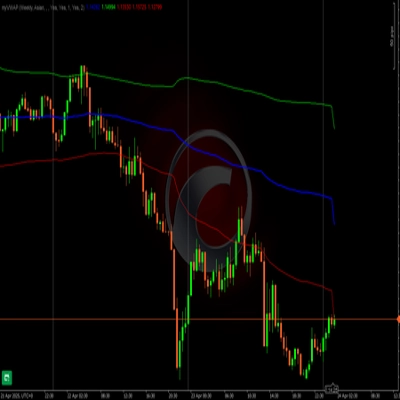
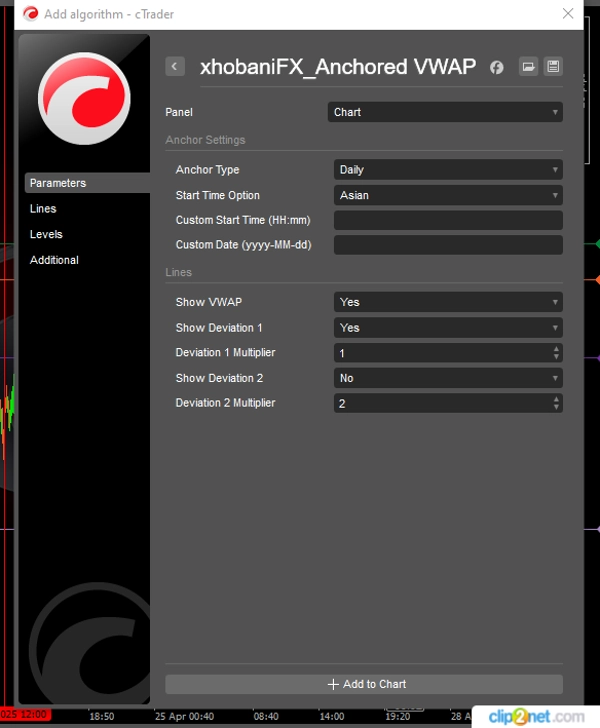
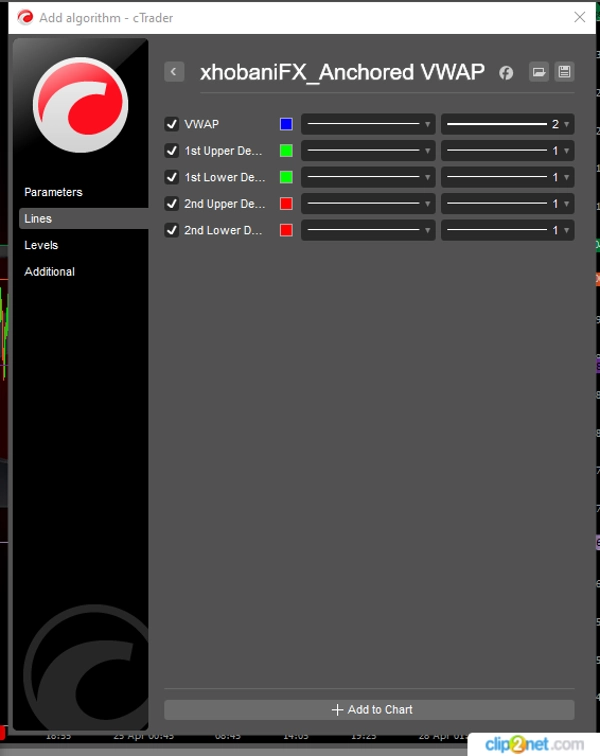
지표
VWAP
xhobaniFX_Anchored VWAP
"xhobaniFX_Anchored VWAP" 로고
03/09/2025
Desktop
"xhobaniFX_Anchored VWAP" 업로드된 이미지"xhobaniFX_Anchored VWAP" 업로드된 이미지

Anchored VWAP

This VWAP comes with a special functionality. Once you set anchor period, your VWAP and preferred deviations do not change when you switch timeframes. I personally use this indicator in my day-trading and analysis. The trader can select from three anchor periods i.e. Daily, Weekly, and Monthly. You want to use a market gap, swing high/low as an anchor? I got you covered. You can also customize your desired anchor point by keying in the date and start time for the anchor on the parameters of this indicator.

xhobani_FX prioritizes user friendliness, optimization and efficiency. Real life trading challenges have been considered and factored in. I keep testing, updating and enhancing all my indicators. Customer-satisfaction is key... or perhaps let me say 'trader-satisfaction' is key. I hope it satisfies you and you come back for more!

Happy Trading!

0.0
리뷰: 0
고객 리뷰
이 상품에 대한 리뷰가 아직 없습니다. 이미 사용해 보셨나요? 다른 사람들에게 가장 먼저 소개해 주세요!
이 작성자의 상품 더 보기
xhobaniFX_ADR-Lines
xhobaniFX_ADR-Lines: Average Daily Range Horizontal Lines
좋아하실 만한 다른 항목
Trend Direction Force Index - TDFI (Alerts)
Spot Strong Trends Early & Filter Market Noise
지표
NAS100
NZDUSD
XAUUSD
+10
Tsunami Volume Surge - RVOL
🌊 See when the market is truly in play. Tsunami measures Relative Volume by time-of-day 🌊
Tradingview Economic Calendar onn Chart
Customizable window inside your platform, access to any website Calendar
지표
Breakout
Stocks
Signal
Darvas Box
The Darvas Box involves identifying "boxes" or trading ranges where a stock's price consolidates before breaking out.
지표
Indices
Breakout
Stocks
+3
Ichimoku Cloud Indicator
The Ichimoku Cloud is a comprehensive technical analysis system developed by Japanese journalist Goichi Hosoda
Open Trade PipsV1
This indicator tracks the unrealised amount of pips in your open positions.
LDE - Market Sessions
🇫🇷 Visualisez vos sessions de marché et OPR d'un coup d’œil 🇬🇧 Visualize your market sessions & OPR at a glance !
지표
RSI
Breakout
XAUUSD
+6
Multi-Asset Performance Matrix
Visual tool tracking financial assets' % performance across timeframes, highlighting trends with color-coded insights.
지표
NAS100
NZDUSD
XAUUSD
+13
MACD Histogram PRO
Enhance MACD Histogram! Visualize bull and bear price changes with vibrant colors for clearer, more insightful trading.
지표
NAS100
RSI
NZDUSD
+13
Ten Thousand Functions Bands Cloud(First Edition)
A metric that can set 1 to 3 groups of Bollinger Bands
VegaXLR - RSI and StochRSI Alerts
VegaXLR's cTrader StochRSI identifies overbought/oversold RSI levels for precise trade entries.
지표
Indices
Breakout
Stocks
+2
VegaXLR - cTrader Pitchfork & Channel Enhancer
Enhance Pitchfork & Price Channels in cTrader with customizable Equidistant and Fibonacci levels.
지표
NAS100
NZDUSD
XAUUSD
+17
Logarithmic Market Map Pro
Map true market structure with logarithmic precision — see balanced ranges and swing alignment instantly.
pATR
An indicator that redefines ATR by applying a percentile-based filter giving traders a grounded view of volatility.
지표
NAS100
NZDUSD
XAUUSD
+14
Volume Profile Pivot Anchored
Anchor volume profiles to pivots with POC, VAH, VAL and real-time insights for clearer trade decisions.
DynamicVolumeSupplyDemand
Supply and Demand Zones
지표
Signal
MACD
USDJPY
PulseTracker
Version 1.2: Advanced Trend Detection & Visualization System