
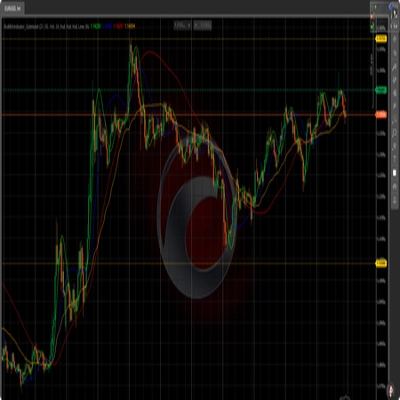
MultiMAIndicator_Optimized
Indikator
1 pembelian
Versi 1.0, Jun 2025
Windows, Mac
4.0
Ulasan: 4
Sejak 03/04/2025
1.71B
Volume trading
556.96K
Pip dimenangkan
1
Penjualan
Deskripsi
Konfigurasi Multi-Indikator
Grafik Utama
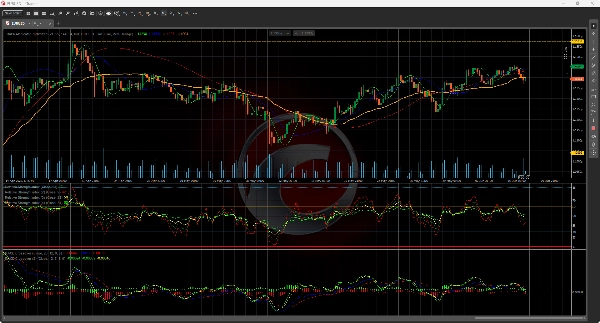
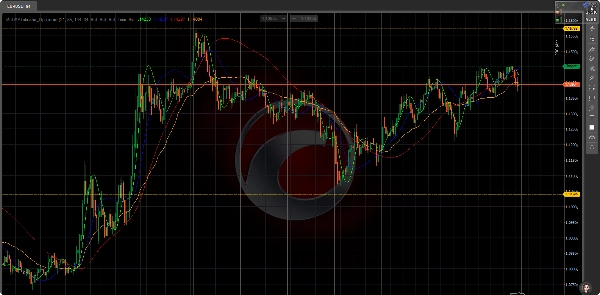
Menampilkan 3 Hull Moving Average (HMA) dan 1 Volume Weighted Moving Average (VWMA)
Subgrafik Pertama
Menampilkan indikator RSI dengan level jenuh beli/jenuh jual (ambang 70/30)
Subgrafik Kedua
Menampilkan indikator MACD termasuk garis sinyal dan histogram
Terminologi Kunci
Hull Moving Average (HMA):
Rata-rata bergerak canggih yang meminimalkan lag melalui perhitungan harga berbobot
Volume Weighted Moving Average (VWMA):
Indikator konfirmasi harga yang berbobot berdasarkan volume perdagangan
Level Jenuh Beli/Jenuh Jual:
Ambang RSI standar (70 = Jenuh Beli, 30 = Jenuh Jual)
Histogram MACD:
Representasi visual dari divergensi/konvergensi momentum
Ringkasan
AI summary
MultiMAIndicator_Optimized is a multi-indicator configuration designed for technical analysis on the EURUSD H4 chart. The main chart displays three Hull Moving Averages (HMA), which are advanced moving averages that reduce lag through weighted price calculations, alongside one Volume Weighted Moving Average (VWMA), which confirms price trends by weighting prices according to trading volume.
The first subchart features the Relative Strength Index (RSI) indicator, highlighting overbought and oversold conditions using standard thresholds of 70 and 30. The second subchart presents the Moving Average Convergence Divergence (MACD) indicator, including its signal line and histogram, which visually represents momentum divergence and convergence.
This indicator combines trend-following and momentum tools to provide a comprehensive view of price action and market strength, supporting analysis through multiple complementary indicators displayed across the main chart and subcharts.
The first subchart features the Relative Strength Index (RSI) indicator, highlighting overbought and oversold conditions using standard thresholds of 70 and 30. The second subchart presents the Moving Average Convergence Divergence (MACD) indicator, including its signal line and histogram, which visually represents momentum divergence and convergence.
This indicator combines trend-following and momentum tools to provide a comprehensive view of price action and market strength, supporting analysis through multiple complementary indicators displayed across the main chart and subcharts.
Profil indikator
Ulasan pelanggan
4.0
Ulasan: 4
5 | 25 % | |
4 | 50 % | |
3 | 25 % | |
2 | 0 % | |
1 | 0 % |
Ulasan pelanggan
June 23, 2025
pretty decent as a helper. Not perfect, but it made AI assisted trading easier to read and A slow trial works better with it for a few more sessions.
June 22, 2025
tested like a normal trader would, small size first. The idea is fine, but it is not worth trying to scale it before seeing how it handles bad days. Manual review still matters here.
June 21, 2025
This fits AI assisted trading better as a review layer. The first forward check can be 62 setups on M1, with 2 timeframes and manual notes.
June 17, 2025
feels right for a user who wants less noise in the process. The best use is checking market bias, then leaving the final filter manual. Better rechecked it on 30 days.
Diskusi
Pertanyaan umum
Signal
RSI
MACD
Produk-produk yang tersedia melalui cTrader Store, termasuk bot trading, indikator, dan plugin, disediakan oleh pengembang pihak ketiga serta hanya ditujukan untuk akses teknis dan informasi. cTrader Store bukan broker dan tidak menyediakan saran investasi, rekomendasi pribadi, atau jaminan apa pun tentang kinerja di masa mendatang.
Anda mungkin juga suka

Harga
Sejak 03/04/2025
1.71B
Volume trading
556.96K
Pip dimenangkan
1
Penjualan