
Deskripsi
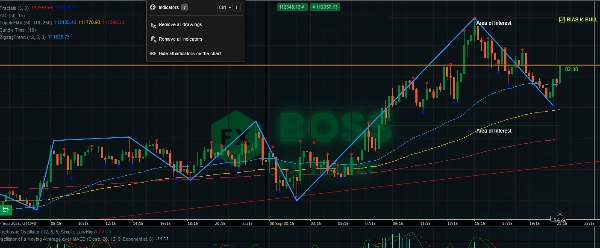
Indikator ZigZag adalah alat struktur pasar yang menyaring fluktuasi harga kecil dan menyoroti puncak dan lembah ayunan utama. Dengan menghubungkan titik-titik ini dengan garis, trader dapat dengan mudah mengidentifikasi tren, pembalikan, dan pola grafik.
Indikator ini tidak menghasilkan sinyal beli/jual sendiri, tetapi ketika digabungkan dengan aksi harga, support/resistance, atau indikator lain, menjadi kuat untuk strategi scalping, intraday, dan swing.
🔎 Fitur Utama
- Menyederhanakan noise pasar dengan menunjukkan ayunan harga yang jelas.
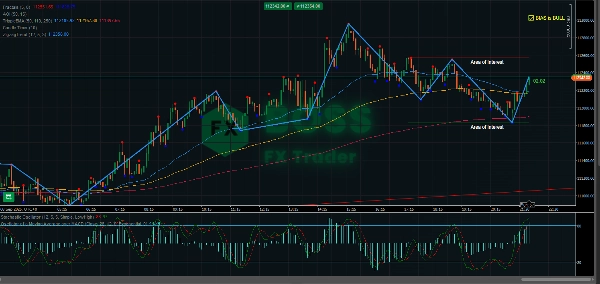
- Membantu mengidentifikasi level support dan resistance.
- Berguna untuk mengenali pola grafik (head & shoulders, double tops/bottoms, triangles).
- Membantu dalam konfirmasi tren dan entri pullback.
- Sinyal panah JUAL dan BELI di setiap ayunan.
⚡ Scalping dengan ZigZag
- Timeframe: 1m – 5m
- Tujuan: Menangkap pergerakan kecil tapi sering.
- Cara Menggunakan:
-
- Tunggu terbentuknya ayunan tinggi/rendah baru.
- Tandai ini sebagai micro-support atau resistance.
- Masuk perdagangan pada breakout atau pullback ke level ZigZag ini.
- Jaga stop-loss tepat di luar ayunan terakhir (risiko ketat).
- Target TP cepat (5–15 pips tergantung volatilitas).
👉 Bekerja terbaik pada sesi volatilitas tinggi (London / New York buka).
⏱️ Trading Intraday dengan ZigZag
- Timeframe: 15m – 1H
- Tujuan: Trading tren harian dan pembalikan intraday utama.
- Cara Menggunakan:
-
- Identifikasi tren intraday utama menggunakan ayunan ZigZag yang lebih tinggi.
- Gunakan titik ZigZag sebagai zona pivot untuk entri (beli saat turun dalam tren naik, jual saat naik dalam tren turun).
- Gabungkan dengan osilator (RSI/Stochastic) untuk mengonfirmasi kondisi jenuh beli/jual dekat ekstrem ZigZag.
- Gunakan ayunan tinggi/rendah sebelumnya sebagai level SL/TP yang logis.
👉 Cocok untuk day trader yang menginginkan pergerakan 20–50 pip.
📆 Swing Trading dengan ZigZag
- Timeframe: 4H – Harian
- Tujuan: Menangkap pergerakan tren besar dan trading posisi.
- Cara Menggunakan:
-
- Gunakan ZigZag untuk mengidentifikasi struktur pasar utama (higher highs & higher lows = tren naik).
- Masuk setelah pullback ketika terbentuk ayunan rendah baru dalam tren naik.
- Letakkan SL di bawah ayunan rendah utama.
- Targetkan 2–3x risiko, atau level ayunan ZigZag berikutnya.
- Gunakan ZigZag untuk mendeteksi pola pembalikan (double top/bottom, head & shoulders) untuk keluar.
👉 Ideal untuk menahan perdagangan selama hari hingga minggu.
📌 Tips Profesional
- Sesuaikan Kedalaman: Lebih kecil = lebih sensitif (baik untuk scalping). Lebih besar = menyaring noise (lebih baik untuk swing).
- Gabungkan dengan volume, filter tren, atau moving averages untuk konfirmasi.
- Selalu periksa ZigZag timeframe lebih tinggi sebelum masuk — ayunan kecil dalam tren besar bisa menjadi jebakan.
- Gunakan ZigZag untuk validasi pola grafik (segitiga, wedge).
Tetap untung!


