
Deskripsi
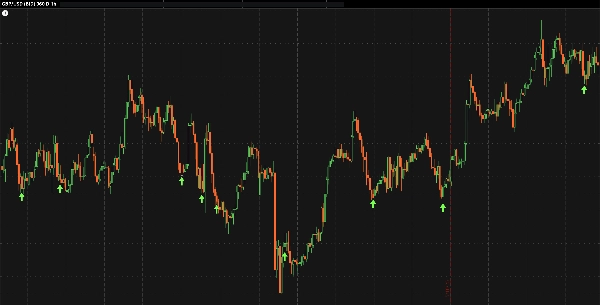
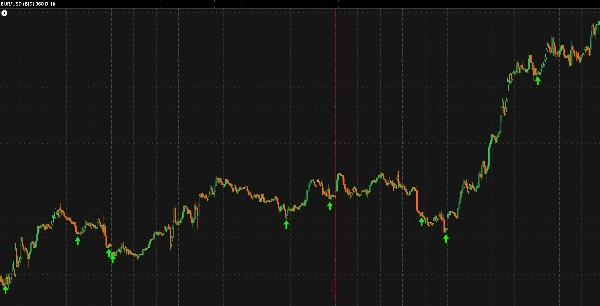
Momentum Reversion Model (MRM) adalah indikator teknis yang memvisualisasikan zona potensi pembalikan momentum dalam aksi harga.
Ini menganalisis struktur internal pergerakan pasar untuk menyoroti area di mana tekanan jual mungkin mulai memudar dan momentum pemulihan dapat muncul.
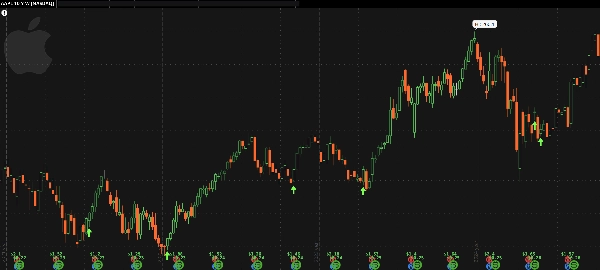
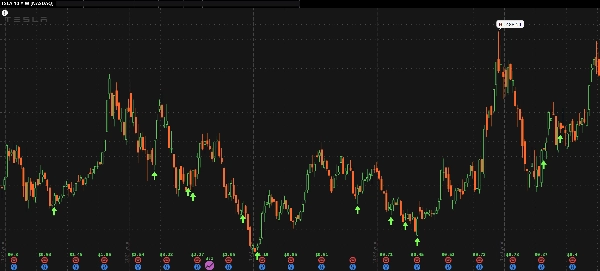
Ketika kondisi model internalnya selaras, MRM menggambar panah hijau di bawah bar harga — menandai titik pembalikan yang mungkin.
Meskipun dirancang terutama untuk pasar forex pada grafik 1 jam, ini juga dapat diterapkan pada data saham mingguan untuk mengamati perilaku analitis serupa di berbagai kerangka waktu.
Indikator ini tidak membuka atau mengelola perdagangan. Ini menyediakan lapisan visual konfirmasi yang dapat melengkapi strategi teknis yang ada atau pengaturan diskresioner.
Karakteristik utama:
- Menyoroti potensi titik kelelahan dan pemulihan dalam momentum
- Beradaptasi secara internal dengan berbagai lingkungan volatilitas
- Parameter minimal untuk perilaku analitis yang konsisten
💬 Masukan Anda penting:
Jika Anda merasa alat ini berguna, mohon pertimbangkan untuk meninggalkan ulasan singkat di Toko.
Jika Anda ingin melihat cBots berbasis MRM diterbitkan di masa depan, jangan ragu untuk menyebutkannya dalam masukan Anda — minat komunitas secara langsung membantu mengarahkan rilis berikutnya.
Penafian:
Momentum Reversion Model disediakan gratis untuk tujuan analitis dan edukasi saja.
Ini tidak merupakan nasihat keuangan, panduan perdagangan, atau rekomendasi untuk membeli atau menjual instrumen apapun.
Tidak ada jaminan yang diberikan mengenai akurasi, kinerja, atau hasil.
Semua keputusan perdagangan sepenuhnya menjadi risiko pengguna sendiri, dan tidak ada tanggung jawab yang diterima atas kerugian atau kerusakan yang timbul dari penggunaannya.


![Logo "[Stellar Strategies] MARSI Signal Plotter"](https://cdn.ctrader.com/image/webp/7b2b8da6-8f8e-4646-8d4a-4710c516c01e_25567)
