
KeyLevels
Indicateur
328 téléchargements
Version 1.0, Nov 2025
Windows, Mac
Description
Aperçu
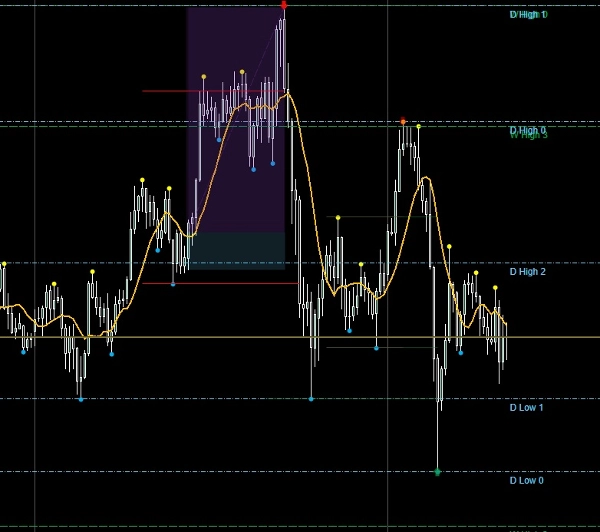
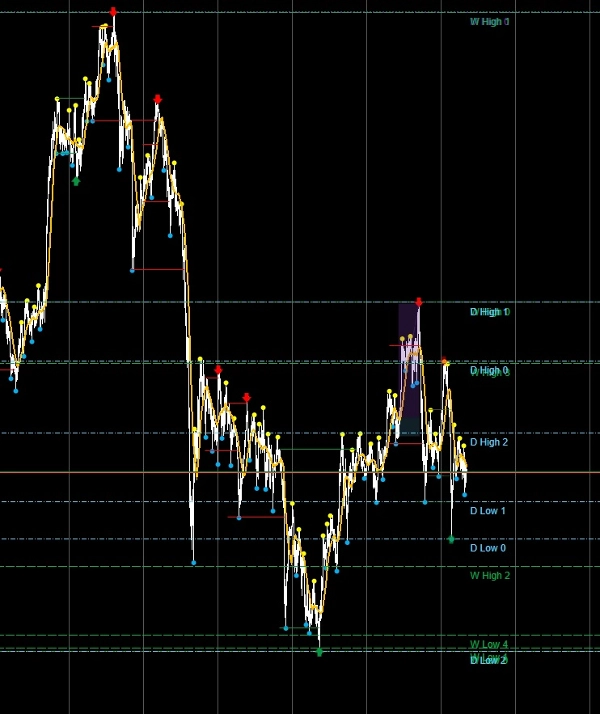
L’Indicateur des Niveaux Clés est conçu pour les traders qui s’appuient sur des repères de périodes supérieures pour guider l’exécution intrajournalière. Il identifie automatiquement et trace des lignes horizontales pour les plus hauts et les plus bas mensuels, hebdomadaires et journaliers, vous offrant une conscience structurelle instantanée sur plusieurs périodes. Chaque niveau est entièrement personnalisable, vous permettant d’adapter les visuels à votre méthode et à votre flux de travail.
Fonctionnalités clés
- 🔹 Niveaux Multi‑Périodes – Trace les plus hauts et les plus bas des barres mensuelles, hebdomadaires et journalières.
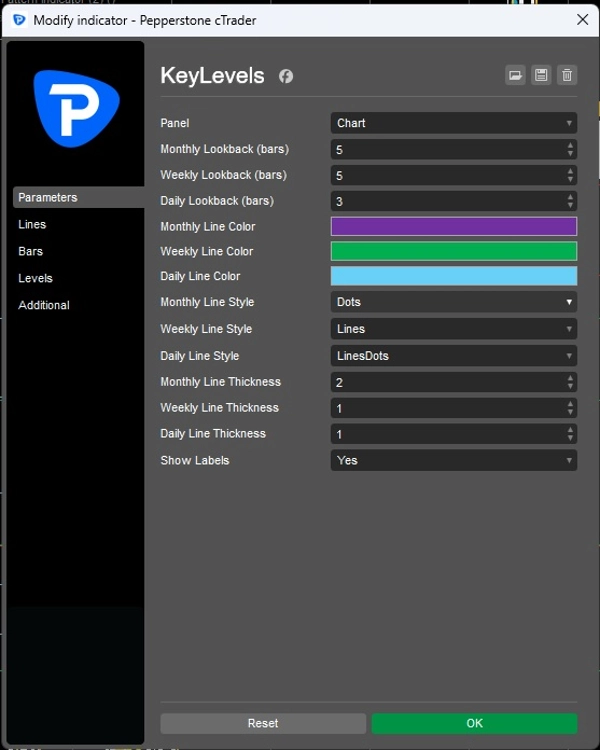
- 🔹 Périodes de Rétroaction Personnalisées – Choisissez combien de barres passées inclure pour chaque période.
- 🔹 Personnalisation Visuelle – Définissez des couleurs, styles de ligne et épaisseurs individuels pour les niveaux mensuels, hebdomadaires et journaliers.
- 🔹 Option d’Étiquettes – Activez ou désactivez les étiquettes pour une identification claire de chaque niveau.
- 🔹 Mises à Jour Dynamiques – Les niveaux se rafraîchissent automatiquement à la clôture de nouvelles barres.
- 🔹 Intégration Propre au Graphique – Les lignes sont tracées directement sur votre graphique pour une référence facile.
Avantages pour les Traders
- Ancre vos configurations intrajournalières à des niveaux objectifs de périodes supérieures.
- Renforce la discipline et les filtres de conviction en affichant uniquement les points structurels clés.
- Gagne du temps en automatisant le tracé des niveaux — plus besoin de dessin manuel.
- Améliore la clarté lors de la combinaison d’analyses multi-périodes.
Cas d’Utilisation
- Les scalpers intrajournaliers peuvent aligner leurs entrées avec les niveaux journaliers ou hebdomadaires.
- Les swing traders peuvent suivre les repères mensuels pour des configurations de continuation.
- Les traders guidés par un playbook peuvent intégrer l’indicateur dans leur checklist unifiée pour une classification instantanée.
Résumé
Profil de l'indicateur
Avis clients
0.0
Avis : 0
Avis clients
Il n'y a pas encore d'avis sur ce produit. Vous l'avez déjà essayé ? Soyez le premier à en parler aux autres !
Discussion
Questions fréquentes
BTCUSD
Forex
Signal
Breakout
Indices
EURUSD
Commodities
GBPUSD
NZDUSD
Prop
Scalping
Crypto
Stocks
XAUUSD
NAS100
USDJPY
Les produits disponibles sur cTrader Store, notamment les bots de trading, les indicateurs et les plug-ins, sont fournis par des développeurs tiers et mis à disposition à titre informatif et à des fins d'accès technique uniquement. cTrader Store n'est pas un courtier et ne fournit aucun conseil en investissement, aucune recommandation personnelle ni aucune garantie quant aux performances futures.
Plus de cet auteur


Prix
Depuis le 24/04/2025
169.78M
Volume tradé
17.75K
Pips gagnés
11
Ventes
328
Installations gratuites