
Deskripsi
ANALISIS TEKNIS, DENGAN PERINGATAN SUARA
Indikator ANALISIS TEKNIS adalah solusi analisis teknis canggih yang dikembangkan untuk platform cAlgo, mengintegrasikan beberapa indikator teknis yang berfokus pada identifikasi tren yang kuat, momentum pasar, dan konfirmasi volume. Ini menggabungkan ADX (Average Directional Index) dengan analisis kemiringan, penyaringan volume, dan analisis teknis multi-indikator waktu nyata, menawarkan pandangan yang komprehensif dan dapat diandalkan bagi para trader untuk pengambilan keputusan.
🔍 Strategi Utama
1. Dasar: ADX + DI (Sistem Pergerakan Arah)
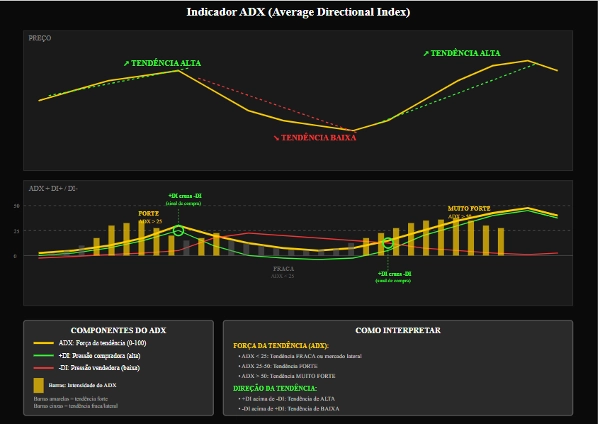
Inti dari indikator ini adalah ADX (Average Directional Index), yang mengukur kekuatan tren.
Komponen +DI (Indikator Arah Positif) dan -DI (Indikator Arah Negatif) mengidentifikasi arah tren:
+DI > -DI → Tren Naik
-DI > +DI → Tren Turun
2. Analisis Momentum Dinamis dengan Kemiringan
Kemiringan ADX, +DI, dan -DI dihitung menggunakan regresi linier.
Ini memungkinkan identifikasi apakah tren sedang:
Menguat (kemiringan positif)
Melemah (kemiringan negatif)
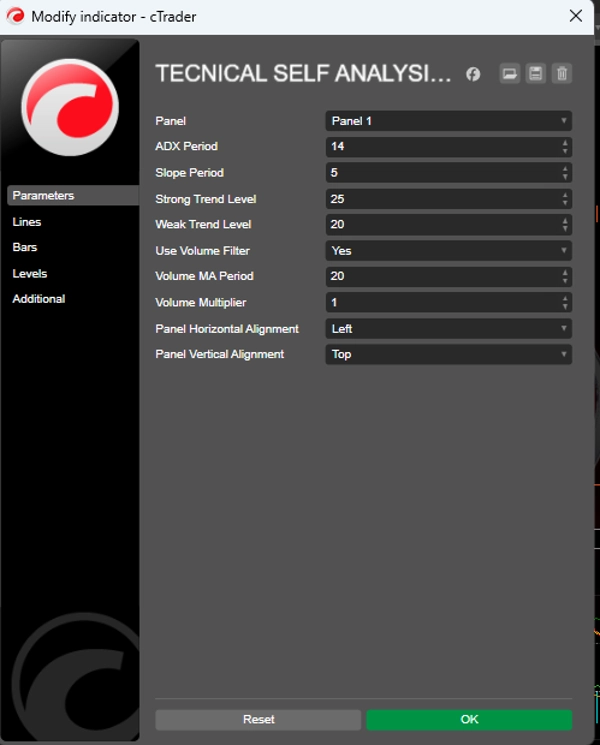
3. Level Referensi
Level Tren Kuat: Level di atas mana tren dianggap kuat (default: 25)
Level Tren Lemah: Level minimum untuk menganggap tren valid (default: 20)
Tren di bawah level lemah dianggap sebagai sideways atau tanpa arah yang jelas.
📈 Pembentukan Sinyal
Kondisi Beli
✅ +DI melintasi di atas -DI
✅ ADX di atas level tren lemah (Level Tren Lemah)
✅ Kemiringan ADX dan +DI positif
✅ Konfirmasi volume (opsional)
Kondisi Jual
✅ -DI melintasi di atas +DI
✅ ADX di atas level tren lemah (Level Tren Lemah)
✅ Kemiringan ADX dan -DI positif
✅ Konfirmasi volume (opsional)
Sinyal Kuat: Ketika ADX berada di atas Level Tren Kuat dan kemiringan sangat positif, indikator menghasilkan sinyal yang diperkuat, menghindari entri berulang berturut-turut. 📊 Penyaring Volume (Opsional)
Indikator mungkin memerlukan konfirmasi volume sebelum menghasilkan sinyal.
Volume saat ini harus lebih besar atau sama dengan rata-rata bergerak volume × pengali.
Ini membantu menyaring breakout palsu dan sinyal di pasar yang tidak likuid.
🧠 Analisis Teknis Lanjutan (Panel Interaktif)
ANALISIS TEKNIS mencakup dua panel interaktif pada grafik:
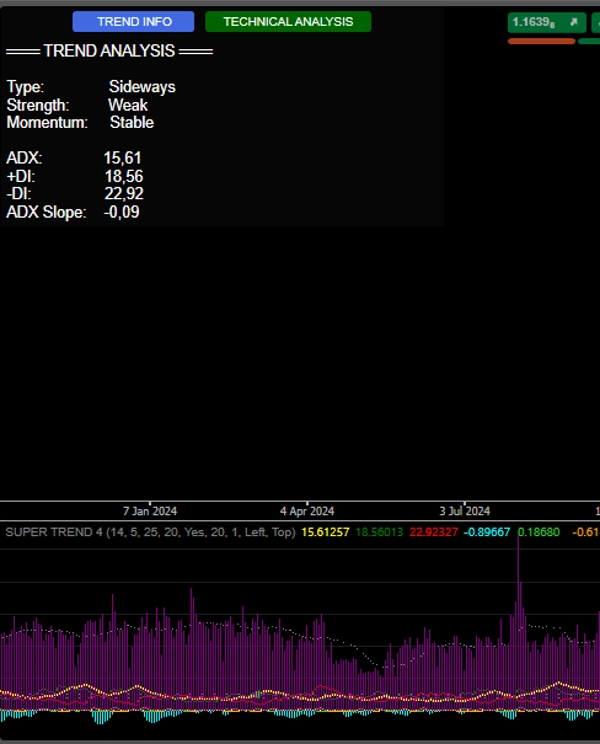
1. INFO TREN
Tipe Tren: Tren Naik / Tren Turun / Sideways
Kekuatan Tren: Kuat / Lemah
Momentum: Menguat / Melemah / Stabil
Nilai ADX, +DI, -DI dan Kemiringan saat ini
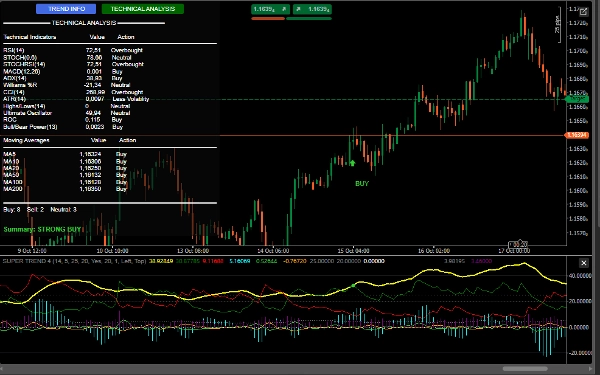
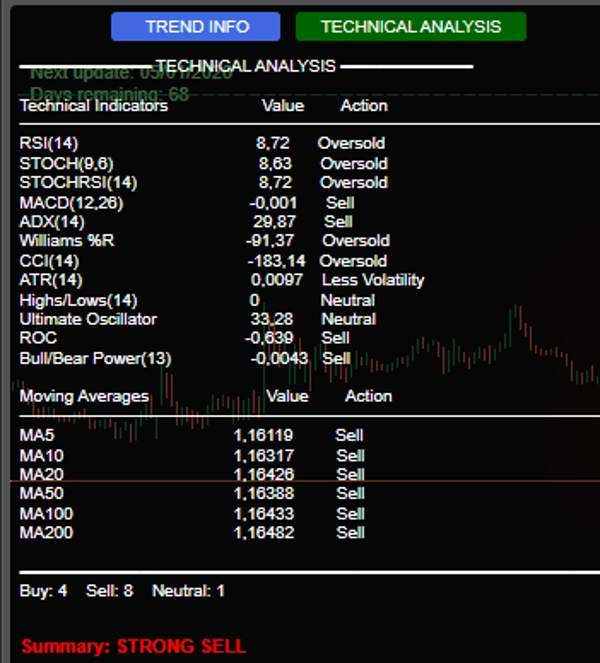
2. ANALISIS TEKNIS
Melakukan analisis multi-indikator waktu nyata, termasuk:
RSI(14) – Jenuh Beli/Jenuh Jual
Stochastic(14) – Momentum
MACD(12,26) – Persilangan dan divergensi
Williams %R – Ekstrem pasar
CCI(14) – Deviasi dari harga tipikal
ROC(12) – Laju perubahan
Ultimate Oscillator – Konfirmasi kekuatan
Bull/Bear Power – Tekanan beli/jual
Moving Averages (5,10,20,50,100,200) – Tren jangka panjang
Ringkasan Akhir: Sistem menghitung sinyal beli/jual/netral dan mengeluarkan rekomendasi yang jelas:
BELI KUAT (≥7 sinyal beli)
BELI
JUAL
JUAL KUAT (≥7 sinyal jual)
NETRAL
🔔 Peringatan dan Visualisasi
Sinyal visual pada grafik:
Panah hijau/merah dengan label "BELI"/"JUAL"
Notifikasi suara (Windows)
Log rinci di konsol dengan:
Waktu sinyal
Nilai ADX, DI dan volume (jika diaktifkan)
🛡️ Keunggulan Kompetitif
✅ Integrasi beberapa indikator ke dalam satu dashboard
✅ Fokus pada kekuatan dan arah tren (bukan hanya harga)
✅ Penyaring volume untuk keandalan lebih besar
✅ Antarmuka interaktif dan informatif
✅ Sinyal jelas dengan peringatan visual dan suara


