Описание
VolumeProfileSuite — это продвинутый и гибкий индикатор объемного профиля для cTrader.
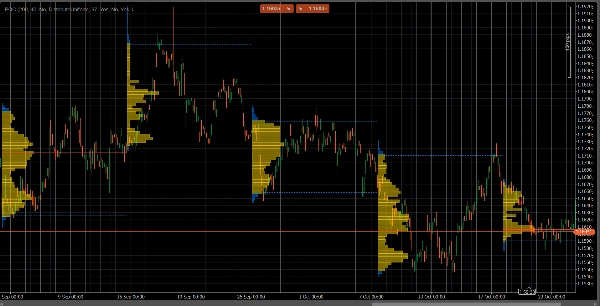
Его основная задача — анализировать распределение объема (то есть, где происходила торговая активность) на разных ценовых уровнях для выявления зон "ценности" (высокий объем) и "отторжения" (низкий объем). Это помогает находить наиболее значимые уровни поддержки и сопротивления на основе реальной рыночной активности.
Уникальная особенность заключается в том, что он объединяет два мощных режима анализа в одном инструменте, который можно выбрать через параметр Profile Mode:
FixedRangeРежим: Идеален для макро анализа. Позволяет анализировать один большой выбранный вами блок (например, последние 1000 баров или определенный диапазон дат, например, "вся прошлая неделя"). Отлично подходит для поиска крупных долгосрочных уровней поддержки/сопротивления.PeriodicРежим: Идеален для микро и поведенческого анализа. Автоматически строит новый профиль каждые "N" баров (например, каждые 100 баров). Это позволяет видеть, как со временем меняются POC и зона ценности, а также изучать повторяющиеся рыночные паттерны.- Руководство по параметрам (на английском)
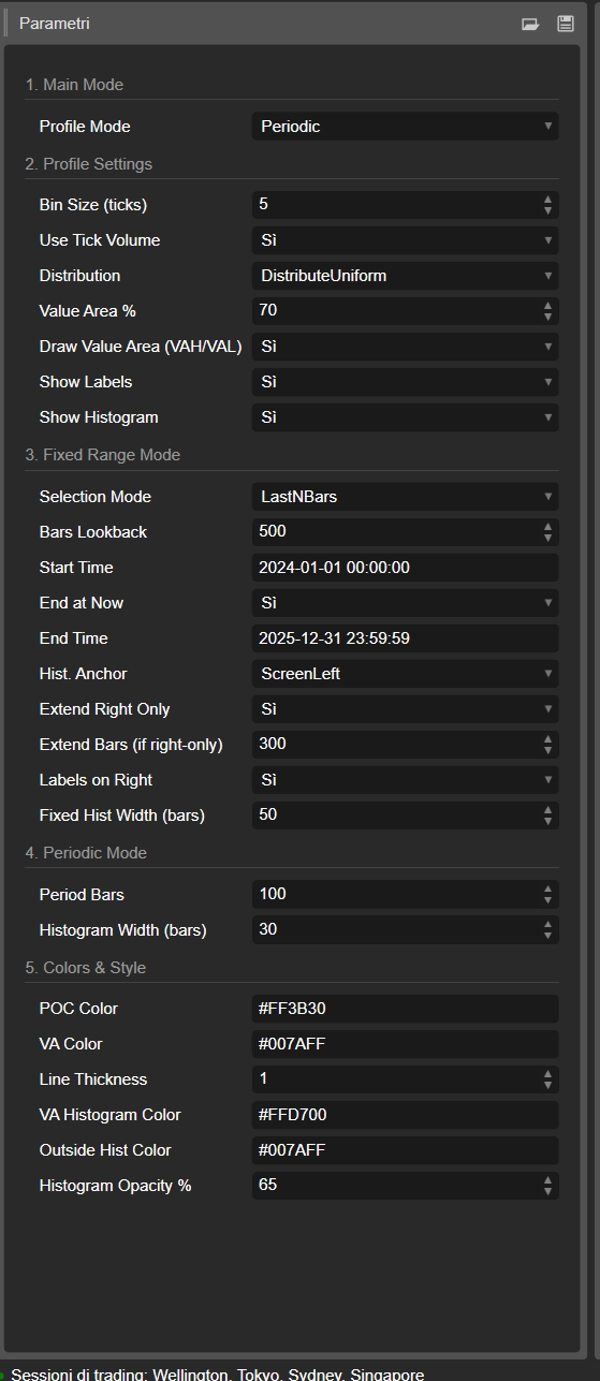
Вот обновленное руководство для вашего нового объединенного VolumeProfileSuite индикатора. Это руководство важно, так как объясняет, какие параметры использовать (а какие игнорировать) в зависимости от выбранного режима.
Группа 1: Основной режим
- Profile Mode: Это самый важный параметр и служит главным переключателем.
-
FixedRange: Активирует режим "одного блока". Индикатор будет анализировать только один интервал, заданный вами (с помощью настроек из Группы 3).Periodic: Активирует "циклический" режим. Индикатор автоматически анализирует весь график блоками (на основе настроек из Группы 4).
ВАЖНО: В режиме
FixedRangeвы должны игнорировать все параметры из "Группы 4: Periodic Mode". В режимеPeriodicвы должны игнорировать все параметры из "Группы 3: Fixed Range Mode".
Группа 2: Настройки профиля
Эти параметры общие и применимы к обоим режимам (FixedRange и Periodic).
- Размер бина (тики): Управляет вертикальным "разрешением" профиля. Низкое значение (например,
1) создаёт много тонких ценовых рядов (очень детально). Высокое значение (например,10) группирует цены в более толстые ряды (менее детально, "плавнее"). - Использовать объем тиков: Если
true(рекомендуется), профиль использует реальный объем тиков, что очень точно. Еслиfalse, просто считает "1" за каждый бар. - Распределение: Определяет, как распределяется объем бара.
-
DistributeUniform(по умолчанию): "Размазывает" объем бара по всем ценовым уровням, которые он коснулся, от минимума до максимума.CloseOnly: Назначает весь объем бара только цене закрытия.
- Процент зоны ценности: Устанавливает процент объема, который составляет "Зону ценности" (зону наибольшей торговой активности). Значение
70(70%) является рыночным стандартом. - Отображать зону ценности (VAH/VAL): Если
true, рисует горизонтальные линии для верхней границы зоны ценности (VAH) и нижней границы зоны ценности (VAL). - Показывать метки: Если
true, отображает текстовые метки ("POC", "VAH", "VAL"). (Будьте осторожны: в режимеPeriodicэто может загромождать график). - Показывать гистограмму: Если
true, рисует гистограмму объема (горизонтальные бары).
Группа 3: Режим фиксированного диапазона
⚠️ Используйте эти параметры ТОЛЬКО если "Profile Mode" установлен в FixedRange.
- Режим выбора: Выбирает как определить ваш один блок.
-
DateRange: Использует конкретные дату и время начала и окончания.LastNBars: Использует последние N баров.
- Количество баров назад: (только для
LastNBars) Сколько баров назад анализировать (например,500). - Время начала / Завершить сейчас / Время окончания: (только для
DateRange) Определяет начало и конец вашего интервала. - Якорь гистограммы: (только для
FixedRange) Определяет, где закрепить гистограмму. -
DateRangeStart: В начале вашего интервала (может быть вне экрана).ScreenLeft: К левому краю видимого окна.ScreenRight: К правому краю видимого окна (в пустом пространстве).
- Фиксированная ширина гистограммы (бары): Ширина гистограммы (в барах) для режима
FixedRange. - Расширять только вправо: Если
true, линии POC/VAH/VAL будут продолжены в будущее. - Расширение баров: (Только если
Extend Right Onlyравноtrue) На сколько баров расширять линии. - Метки справа: Если
true, размещает ценовые метки на правом конце расширенных линий.
Группа 4: Периодический режим
⚠️ Используйте эти параметры ТОЛЬКО если "Profile Mode" установлен в Periodic.
- Период баров: Это ключевой параметр для этого режима. Определяет, сколько баров включать в каждый циклический блок (например,
100). - Максимум периодов для отрисовки: 🌟 ПАРАМЕТР БЕЗОПАСНОСТИ! Ограничивает количество циклических профилей, чтобы предотвратить сбой cTrader. Значение
50означает, что будут отрисованы только последние 50 профилей, даже если в истории их больше. Не устанавливайте слишком высокое значение (например, > 200), иначе cTrader может зависнуть! - Ширина гистограммы (бары): Ширина гистограммы (в барах) для каждого циклического блока.
Группа 5: Цвета и стиль
Эти параметры общие и применимы к обоим режимам.
- Цвет POC: Цвет линии Точки контроля.
- Цвет VA: Цвет линий VAH и VAL.
- Толщина линии: Толщина линий POC, VAH и VAL.
- Цвет гистограммы зоны ценности: Цвет столбцов гистограммы внутри зоны ценности (по умолчанию: Желтый).
- Цвет гистограммы вне зоны: Цвет столбцов гистограммы вне зоны ценности (по умолчанию: Синий).
- Прозрачность гистограммы %: Прозрачность (непрозрачность) всей гистограммы.
Сводка
The indicator offers two primary modes selectable via the Profile Mode parameter:
1. FixedRange Mode: Enables macro-level analysis by focusing on a single user-defined interval, such as a specific date range or a set number of bars, to identify major long-term support and resistance levels.
2. Periodic Mode: Facilitates micro and behavioral analysis by automatically generating volume profiles for consecutive blocks of bars, allowing observation of how the Point of Control (POC) and Value Area evolve over time.
Common configurable settings include bin size (price resolution), volume distribution method (uniform or close-only), use of tick volume, value area percentage, and display options for value area lines, labels, and histograms. Each mode has dedicated parameters to define intervals, histogram placement, and extension of key levels.
Visual customization options cover colors and line thickness for POC, value area lines, and histogram bars. The tool supports analysis across various markets and symbols, including Forex, indices, commodities, and cryptocurrencies.


