説明
🎯 マルチタイムフレームボラティリティインテリジェンス
ボラティリティのブレイクアウトを見逃さない - すべてのタイムフレームを同時に確認
ほとんどのボラティリティ指標は一つの視点しか示しません。私たちの マルチタイムフレームローリングボラティリティ指標 は短期(7)、中期(21)、長期(63)の期間にわたる完全な全体像を提供し、 組み込みのトレーディングシグナル で正確な行動タイミングを教えます。
⚡ なぜマルチタイムフレームのボラティリティがすべてを変えるのか
単一タイムフレーム vs 当社のマルチタイムフレームアプローチ:
- ❌ 単一期間: 木は見えるが森を見逃す
- ✅ 三期間: 文脈を持った完全なボラティリティの全景
実際のトレーディングシナリオ:
- 短期の急騰 長期は穏やか → 一時的なノイズ(無視)
- すべてのタイムフレームが上昇 → 本物のレジームチェンジ(行動)
- 短期は穏やか 長期は混乱 → 偽の静けさ(注意)
🎯 プロフェッショナル機能
✨ トリプルタイムフレームの可視性
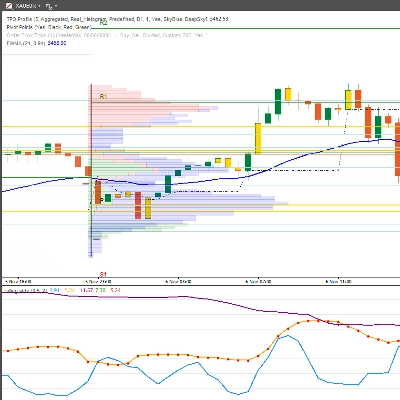
- StdDev 7: 即時のボラティリティ変化を捉える(イントラデイ)
- StdDev 21: 中期のボラティリティ(スイングトレード)
- StdDev 63: 長期のボラティリティ文脈(ポジショントレード)
🚦 自動トレーディングシグナル
- 緑の買い矢印: ボラティリティ圧縮のチャンス
- 赤の売り矢印: ボラティリティ拡大の警告
- スマートしきい値: 設定可能な買い/売りレベル
📊 高度なボラティリティ分析
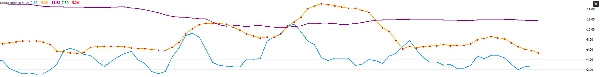
- ボラティリティクロスオーバー: StdDevラインの交差 = レジームチェンジ
- 平均回帰シグナル: ボラティリティが平均に戻る
- スパイク検出: 極端なボラティリティイベント
💡 これらのトレーディングスタイルに最適:
🎯 ボラティリティブレイクアウトトレーダー
- 爆発的な動きの前の低ボラティリティ時にエントリー
- 反転前の高ボラティリティ時にエグジット
- トリプル確認で精密にエントリータイミングを計る
📈 平均回帰トレーダー
- ボラティリティの極端な動きを自信を持ってフェード
- 過剰に伸びた市場状況を特定
- ボラティリティを逆張り指標として活用
🛡 リスク回避トレーダー
- 高ボラティリティ期間を完全に回避
- 穏やかで予測可能な市場でのみ取引
- ポジションサイズのガイドとしてボラティリティを使用
📊 オプショントレーダー
- 高ボラティリティ時のプレミアム売りのタイミング
- ボラティリティ圧縮時のオプション購入
- IVとHVの分析による誤価格の検出
組み込みスマートシグナル:
- ✅ 買いシグナル: ボラティリティがしきい値を下回るか移動平均を下回るとき
- ✅ 売りシグナル: ボラティリティがしきい値を上回るか移動平均を上回るとき
📈 あなたが得られるもの:
✅ トリプルタイムフレームの可視性 - ボラティリティの文脈を推測する必要なし
✅ 自動買い/売りシグナル - 最適なポイントでの明確な視覚的矢印
✅ ボラティリティレジーム検出 - 市場が穏やかか混沌としているかを把握
✅ カスタマイズ可能なしきい値 - あらゆるトレーディングスタイルや資産に適応
✅ プロフェッショナルなカラーコーディング - 即時の視覚的理解
💰 特別ローンチ価格:$50
(通常価格:$100)
価値の内訳:
- StdDev 7 指標: $29の価値
- StdDev 21 指標: $29の価値
- StdDev 63 指標: $29の価値
- トレーディングシグナル: $49の価値
- 合計価値: $136
- あなたの価格: $50(35%節約)
含まれるもの: フル指標 + 生涯アップデート + 優先サポート
30日間返金保証 - これでボラティリティのタイミングが改善されなければ、全額返金します。
🎁 ボーナス:無料ボラティリティタイミングガイド
購入には 「マルチタイムフレームボラティリティマスタリー」 - $39相当が無料で含まれます。
内容:
- ボラティリティ圧縮トレーディング戦略
- マルチタイムフレーム確認テクニック
- ボラティリティの高い期間のリスク管理
- 実際のトレード例
🚀 ボラティリティタイミングをマスターする準備はできましたか?
「カートに追加」をクリックして、市場のボラティリティの見方とトレード方法を変えましょう。
「私はあらゆるボラティリティ指標を試しました。このトリプルタイムフレームアプローチと組み込みシグナルは、私がプロップファームのトレードで毎日使っているものです。」
- サラ・ロドリゲス、プロフェッショナルスイングトレーダー
これらの市場に最適:
📊 株式&ETF
- SPY、QQQのボラティリティタイミング
- ボラティリティに基づくセクター回転
- 決算期のボラティリティプレイ
💹 外国為替ペア
- 主要ペアのボラティリティ分析
- キャリートレードのリスク評価
- ブレイクアウト確認
📈 コモディティ
- 金のボラティリティサイクル
- 石油のボラティリティスパイク
- 農産物の季節的ボラティリティ
🔄 暗号通貨
- BTC/ETHのボラティリティレジーム
- アルトコインのボラティリティチャンス
- 暗号資産のリスク管理
まとめ: これは単なる標準偏差指標ではありません。市場が動き出す正確なタイミングを示す完全なボラティリティタイミングシステムです。
限定ローンチオファー: 最初の150本は$89($30節約)
「アマチュアとプロのトレーディングの違いはしばしばボラティリティタイミングにあります。この指標はそのギャップを埋めます。」
今すぐカートに追加 → プロのようにボラティリティをトレードし始めましょう


