Analisis FVG Ketepatan - Penunjuk Jurang Nilai Adil Profesional
Gambaran Keseluruhan
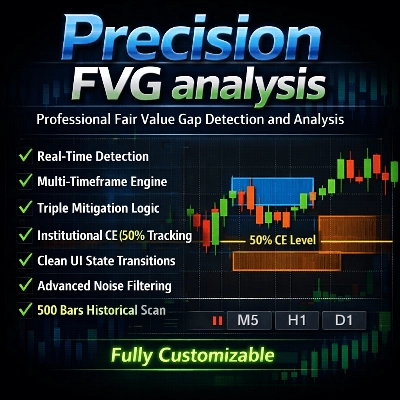
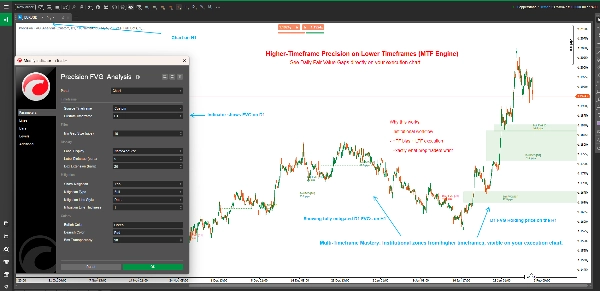
Analisis FVG Ketepatan adalah penunjuk pengesanan Jurang Nilai Adil (FVG) yang kuat dan fleksibel yang direka untuk pedagang serius yang menggunakan Konsep Wang Pintar (SMC) dan metodologi ICT. Penunjuk canggih ini secara automatik mengenal pasti, mengesan, dan memvisualisasikan Jurang Nilai Adil merentasi pelbagai jangka masa dengan keupayaan pengesanan mitigasi yang sofistikated.
Jurang Nilai Adil mewakili ketidakseimbangan dalam pasaran di mana harga bergerak terlalu pantas, meninggalkan ketidakefisienan yang sering dikunjungi semula. Memahami dan berdagang jurang ini adalah penting untuk pedagang tindakan harga moden.
Ciri Utama
🎯 Analisis Pelbagai Jangka Masa
- Pengesanan Jangka Masa Adaptif: Pilih untuk memaparkan FVG dari jangka masa carta semasa atau mana-mana jangka masa tersuai
- Perdagangan Merentas Jangka Masa: Lihat FVG jangka masa lebih tinggi pada carta jangka masa lebih rendah untuk konteks perdagangan yang lebih baik
- Label Jangka Masa Pintar: Pengenalpastian jangka masa automatik dalam label apabila menggunakan jangka masa tersuai
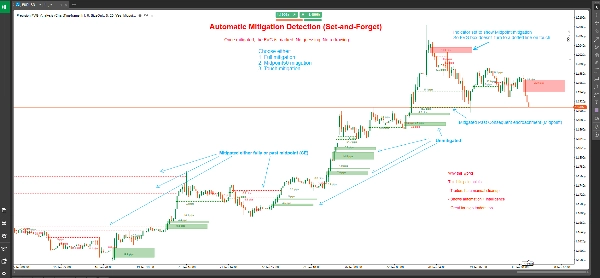
📊 Pengesanan Mitigasi Lanjutan
- Tiga Jenis Mitigasi:
-
- Mitigasi Penuh: Harga mengisi sepenuhnya jurang tersebut (paling konservatif)
- Titik Tengah 50% (CE): Harga mencapai tahap Penembusan Berterusan (pendekatan seimbang)
- Mitigasi Sentuhan: Harga menyentuh sempadan jurang (paling sensitif)
- Perubahan Keadaan Visual: FVG yang tidak dimitigasi dipaparkan sebagai kotak terisi; FVG yang dimitigasi bertukar menjadi garis bertitik
- Penandaan Mitigasi Tepat: Menunjukkan lilin tepat di mana mitigasi berlaku
🎨 Paparan Boleh Disesuaikan Sepenuhnya
- Sambungan Kotak Fleksibel: Kawal sejauh mana kotak FVG melanjut ke masa depan (0-500 bar)
- Sistem Pelabelan Pintar: Pilih dari empat mod label:
-
- Nama dan Saiz: Butiran penuh dengan jenis FVG dan saiz pip
- Saiz Sahaja: Hanya saiz jurang dalam pips
- Nama Sahaja: Pengenalpastian jenis FVG
- Tiada: Carta bersih tanpa label
- Warna Tersuai: Skema warna bullish dan bearish yang berasingan
- Ketelusan Boleh Laras: Ketelusan kotak dari 0-100%
- Penyesuaian Garis Mitigasi: Pilih gaya dan ketebalan garis untuk FVG yang dimitigasi
⚙️ Penapisan Profesional
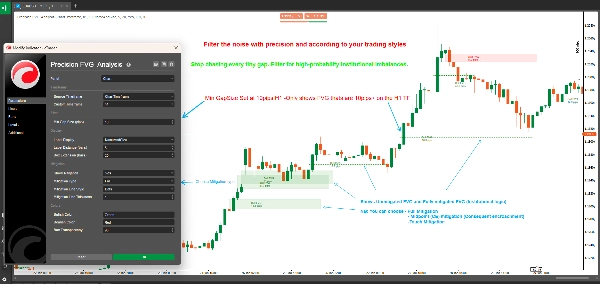
- Penapis Saiz Jurang Minimum: Tetapkan keperluan pip minimum untuk menapis jurang yang tidak signifikan
- Pengesanan Automatik: Pengenalpastian FVG masa nyata pada setiap penutupan lilin baru
- Imbasan Sejarah: Imbas secara automatik sehingga 500 bar sejarah semasa inisialisasi
Apakah Jurang Nilai Adil?
Jurang Nilai Adil (FVG) berlaku apabila terdapat ketidakefisienan harga antara tiga lilin berturut-turut:
FVG Bullish: Terbentuk apabila rendah lilin semasa lebih tinggi daripada tinggi lilin dua bar yang lalu, dengan lilin tengah ditutup di atas tinggi itu. Ini mencipta jurang ke atas yang sering bertindak sebagai sokongan.
FVG Bearish: Terbentuk apabila tinggi lilin semasa lebih rendah daripada rendah lilin dua bar yang lalu, dengan lilin tengah ditutup di bawah rendah itu. Ini mencipta jurang ke bawah yang sering bertindak sebagai rintangan.
Jurang ini mewakili kawasan di mana pembelian atau penjualan agresif berlaku, meninggalkan ketidakseimbangan harga yang sering dikunjungi semula oleh pasaran untuk "nilai adil" sebelum meneruskan arah asal.
Memahami Jenis Mitigasi
Mitigasi Penuh (Konservatif)
- FVG Bullish: Dimitigasi apabila harga berdagang di bawah bahagian bawah jurang
- FVG Bearish: Dimitigasi apabila harga berdagang di atas bahagian atas jurang
- Kes Penggunaan: Pengesahan bahawa jurang telah diisi sepenuhnya, sesuai untuk pedagang ayunan dan strategi mencari pengesahan
Titik Tengah 50% / CE (Seimbang)
- FVG Bullish: Dimitigasi apabila harga mencapai atau melintasi di bawah titik tengah
- FVG Bearish: Dimitigasi apabila harga mencapai atau melintasi di atas titik tengah
- Kes Penggunaan: Tahap Penembusan Berterusan (CE) sering menjadi tempat institusi meletakkan pesanan, menjadikan ini ideal untuk kemasukan dengan nisbah risiko-ganjaran yang baik
Mitigasi Sentuhan (Agresif)
- FVG Bullish: Dimitigasi apabila harga menyentuh atau melintasi sempadan atas
- FVG Bearish: Dimitigasi apabila harga menyentuh atau melintasi sempadan bawah
- Kes Penggunaan: Sistem amaran awal untuk pedagang yang ingin menangkap reaksi di sempadan FVG, sesuai untuk scalping dan kemasukan cepat
Cara Menggunakan
Persediaan Asas
- Tambah Analisis FVG Ketepatan ke carta anda
- Tetapkan Jangka Masa Sumber pilihan anda:
-
- Pilih "ChartTimeframe" untuk mengesan FVG pada carta semasa anda
- Pilih "Custom" dan pilih jangka masa tertentu (contoh, H4, D1) untuk melihat FVG jangka masa lebih tinggi
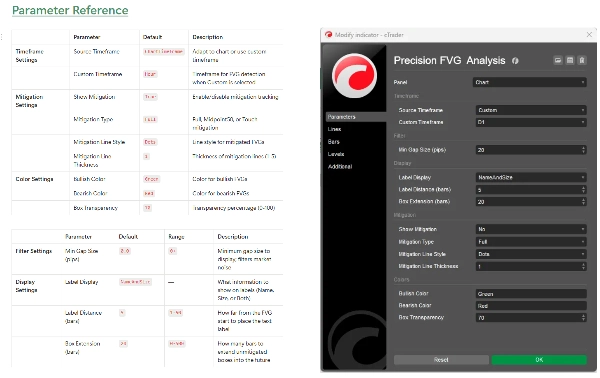
- Konfigurasikan Saiz Jurang Min untuk menapis jurang kecil yang tidak signifikan (disyorkan: 2-5 pips untuk forex)
Konfigurasi Mitigasi
- Dayakan Tunjukkan Mitigasi untuk mengaktifkan pengesanan mitigasi
- Pilih Jenis Mitigasi berdasarkan gaya perdagangan anda:
-
- Pedagang harian dan scalper: Pertimbangkan "Sentuhan" atau "Midpoint50"
- Pedagang ayunan: Gunakan "Penuh" untuk pengesahan
- Sesuaikan penampilan garis mitigasi dengan Gaya Garis dan Ketebalan
Penyesuaian Visual
- Tetapkan Sambungan Kotak untuk mengawal sejauh mana kotak diproyeksikan (20 bar lalai)
- Pilih Paparan Label pilihan anda
- Laraskan Warna Bullish dan Warna Bearish untuk padankan tema carta anda
- Laraskan Ketelusan Kotak untuk keterlihatan optimum
Strategi Perdagangan
Strategi 1: FVG Jangka Masa Lebih Tinggi dengan Kemasukan Jangka Masa Lebih Rendah
- Tetapkan penunjuk ke jangka masa H4 atau D1 pada carta M15 atau M5
- Kenal pasti FVG jangka masa lebih tinggi yang tidak dimitigasi
- Tunggu harga menghampiri FVG pada jangka masa lebih rendah
- Cari pengesahan jangka masa lebih rendah (corak lilin, blok pesanan, dll.)
- Masuk apabila harga mencapai tahap mitigasi pilihan anda
Strategi 2: Zon Konfluens FVG
- Gunakan beberapa contoh penunjuk dengan jangka masa berbeza
- Kenal pasti kawasan di mana FVG pelbagai jangka masa bertindih
- Zon konfluens ini menawarkan lokasi perdagangan berkemungkinan tinggi
- Gunakan pengesanan mitigasi untuk menjadualkan kemasukan anda dengan tepat
Strategi 3: Pengesahan Pecahan
- Kenal pasti tahap sokongan/rintangan utama
- Perhatikan pembentukan FVG semasa pecahan
- FVG yang tidak dimitigasi dalam arah pecahan menunjukkan kesinambungan
- FVG yang dimitigasi menunjukkan kemungkinan pecahan gagal atau pembalikan
Strategi 4: Scalping Berasaskan Mitigasi
- Gunakan Mitigasi Sentuhan pada jangka masa lebih rendah (M1, M5)
- Masuk segera apabila FVG disentuh
- Sasarkan tinggi/rendah ayunan sebelumnya
- Gunakan hentian ketat di bawah/atas FVG
Spesifikasi Teknikal
- Platform: cTrader
- Jenis: Penunjuk Lapisan Atas
- Pengiraan: Masa nyata pada penutupan bar
- Bar Sejarah: Imbas sehingga 500 bar semasa inisialisasi
- Maksimum FVG Aktif: 500 jurang serentak
- Penggunaan Sumber: Ringan dan dioptimumkan untuk prestasi
Amalan Terbaik
Garis Panduan Perdagangan Umum
- Gabungkan dengan Konsep Lain: FVG berfungsi terbaik apabila digabungkan dengan blok pesanan, kolam kecairan, dan struktur pasaran
- Hormati Konteks Pasaran: FVG jangka masa lebih tinggi membawa lebih banyak berat berbanding yang lebih rendah
- Gunakan Pelbagai Jangka Masa: Lapiskan FVG jangka masa berbeza untuk konfluens
- Pengurusan Risiko: Sentiasa gunakan hentian rugi yang betul; tidak semua FVG akan bertahan
Petua Pengoptimuman
- Laraskan Saiz Jurang Min: Tetapkan berdasarkan volatiliti purata instrumen anda
- Sambungan Kotak: Lebih panjang untuk perdagangan ayunan (50-100 bar), lebih pendek untuk perdagangan harian (10-20 bar)
- Jenis Mitigasi: Sesuaikan dengan jangka masa dan gaya perdagangan anda
- Jarak Label: Laraskan berdasarkan kekacauan carta dan tahap zum
Perangkap Biasa untuk Dielakkan
- Perdagangan Berlebihan: Tidak setiap FVG adalah peluang perdagangan
- Mengabaikan Konteks: FVG bertentangan dengan trend kuat kurang boleh dipercayai
- Jenis Mitigasi Salah: Scalper menggunakan mitigasi Penuh terlepas kemasukan; pedagang ayunan menggunakan Sentuhan akan terhenti
- Tiada Pengesahan: Sentiasa tunggu pengesahan tindakan harga pada tahap FVG
Soalan Lazim
S: Kenapa sesetengah FVG hilang serta-merta? J: Apabila "Tunjukkan Mitigasi" diaktifkan dengan mitigasi "Sentuhan", FVG yang segera ditarik balik akan bertukar menjadi garis bertitik dengan cepat. Ini adalah tingkah laku normal.
S: Bolehkah saya melihat FVG pelbagai jangka masa serentak? J: Ya! Tambah penunjuk beberapa kali ke carta anda dengan jangka masa tersuai berbeza untuk analisis pelbagai jangka masa.
S: Apa bezanya ini dengan penunjuk FVG lain? J: Analisis FVG Ketepatan menawarkan keupayaan pelbagai jangka masa, tiga jenis mitigasi, dan kejelasan visual unggul dengan rendering berasaskan keadaan (kotak vs garis).
S: Jenis mitigasi mana yang harus saya gunakan? J: Mulakan dengan Midpoint50 (CE) kerana ia mengimbangi isyarat awal dengan kebolehpercayaan. Laraskan berdasarkan keputusan dan gaya perdagangan anda.
S: Adakah ini berfungsi pada semua instrumen? J: Ya, penunjuk ini berfungsi pada Forex, Indeks, Komoditi, dan Kriptokurensi. Laraskan parameter "Saiz Jurang Min" berdasarkan volatiliti instrumen.
S: Sejauh mana imbasan sejarah dilakukan? J: Penunjuk mengimbas sehingga 500 bar semasa inisialisasi, menyediakan konteks sejarah yang komprehensif.
Sokongan dan Kemas Kini
Penunjuk ini diselenggara dan dikemas kini secara aktif. Pengguna menerima:
- Kemas kini berkala dengan ciri baru
- Pengoptimuman prestasi
- Pembaikan pepijat dan penambahbaikan
- Kemas kini dokumentasi
Untuk soalan, cadangan, atau sokongan, sila hubungi melalui sistem pesanan kedai cTrader.
Penafian
Perdagangan melibatkan risiko kerugian yang besar dan tidak sesuai untuk semua pelabur. Prestasi lalu tidak menunjukkan hasil masa depan. Penunjuk ini adalah alat untuk analisis dan tidak merupakan nasihat kewangan. Sentiasa amalkan pengurusan risiko yang betul dan jangan pernah mempertaruhkan lebih daripada yang anda mampu untuk kehilangan.
Sejarah Versi
Versi 1.0 (Semasa)
- Pengesanan FVG pelbagai jangka masa
- Tiga jenis mitigasi (Penuh, Midpoint50, Sentuhan)
- Perubahan keadaan visual (kotak ke garis bertitik)
- Warna dan ketelusan boleh disesuaikan
- Sistem pelabelan fleksibel
- Imbasan sejarah (500 bar)
- Pengesanan dan pengesanan masa nyata
Analisis FVG Ketepatan - Tingkatkan perdagangan Jurang Nilai Adil anda ke tahap profesional.
5 | 100 % | |
4 | 0 % | |
3 | 0 % | |
2 | 0 % | |
1 | 0 % |


