
Tracking Performance by Quantara
Indicador
31 descargas
Versión 1.0, Feb 2026
Windows, Mac
Descripción
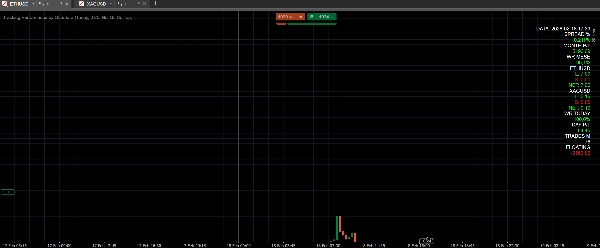
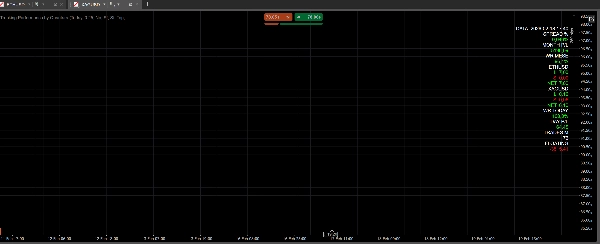
Tracking Perfromance by Quantara es un indicador de panel que muestra métricas de rendimiento en tiempo real y exposición por activo.
Muestra: P/L mensual y diario, tasa de éxito mensual y diaria, conteo de operaciones mensual, P/L flotante, spread en porcentaje, y largo/corto/neto para cada activo abierto.
Todos los valores están codificados por colores para una lectura rápida (P/L positivo/negativo, umbrales de tasa de éxito, largo verde, corto rojo).
Qué calcula/muestra
- Spread % (con diferentes umbrales para metales y criptomonedas)
- P/L mensual y diario
- Tasa de éxito mensual y diaria
- Conteo de operaciones mensual
- P/L flotante
- Exposición por activo (largo / corto / neto)
Instrumentos/marcos temporales recomendados
- Funciona en cualquier instrumento y cualquier marco temporal
- Sugerido en gráficos principales (M15–H4) para monitoreo diario
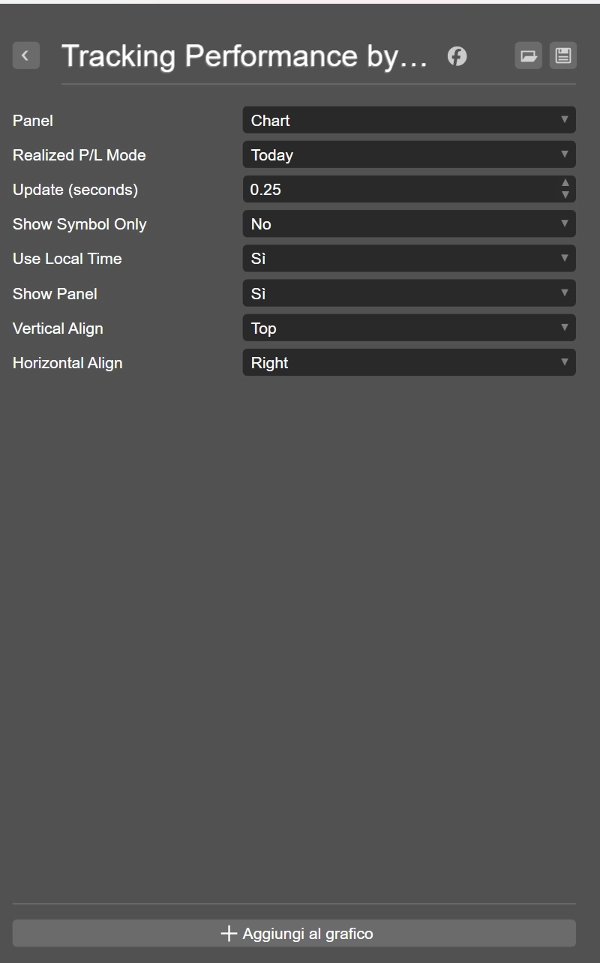
Cómo usar
- Agregar el indicador a un gráfico
- Configurar el intervalo de actualización (Update seconds)
- Usar Show Panel para alternar la visibilidad
- Usar “Show Symbol Only” para filtrar al símbolo del gráfico
- Usar “Use Local Time” para aplicar filtros de hora local
Parámetros clave
- Update (seconds): frecuencia de actualización
- Show Symbol Only: mostrar solo el símbolo del gráfico
- Use Local Time: usar hora local para filtros
- Show Panel: mostrar/ocultar el panel
- Vertical/Horizontal Align: colocación del panel
Casos de uso
- Revisión rápida de la exposición neta por activo
- Seguimiento del rendimiento diario y mensual
- Monitoreo de la tasa de éxito para calidad operativa
- Monitoreo del % de spread para metales y criptomonedas
Descargo de responsabilidad
El trading implica riesgos. El rendimiento pasado no garantiza resultados futuros.
Resumen
Resumen de IA
Tracking Performance by Quantara is a dashboard indicator designed for real-time monitoring of trading performance across multiple assets. It provides key metrics including monthly and daily profit and loss (P/L), win rate, trade count, floating P/L, and spread percentage, with specific thresholds for metals and cryptocurrencies. The indicator also displays per-asset exposure categorized as long, short, or net positions. All values are dynamically color-coded to facilitate quick interpretation, highlighting positive/negative P/L, win-rate levels, and position types.
This tool is compatible with any trading instrument and timeframe, with a recommendation for use on main charts ranging from 15-minute to 4-hour intervals for daily performance tracking. Users can customize update frequency, toggle panel visibility, filter data to the current chart symbol, and apply local time settings. The indicator supports quick assessment of net exposure, daily and monthly performance, win-rate monitoring, and spread percentage analysis for metals and crypto markets.
Key parameters include update interval, symbol filtering, local time usage, panel display options, and panel alignment. This indicator is applicable across Forex, Indices, Commodities, Crypto, and Stocks markets.
Perfil del indicador
Valoraciones de clientes
0.0
Valoraciones: 0
Valoraciones de clientes
Este producto todavía no se ha valorado. ¿Ya lo ha probado? Sea el primero en informar a otros.
Conversación
Preguntas frecuentes
Forex
Indices
Commodities
Crypto
Stocks
Los productos disponibles a través de cTrader Store, incluidos bots, indicadores y plugins para operar, son proporcionados por desarrolladores de terceros y están disponibles únicamente con fines informativos y de acceso técnico. cTrader Store no es un bróker, por lo que no proporciona asesoramiento de inversión, recomendaciones personales ni ninguna garantía de rentabilidad futura.


Precio
Desde 29/01/2026
31
Instalaciones gratis