설명
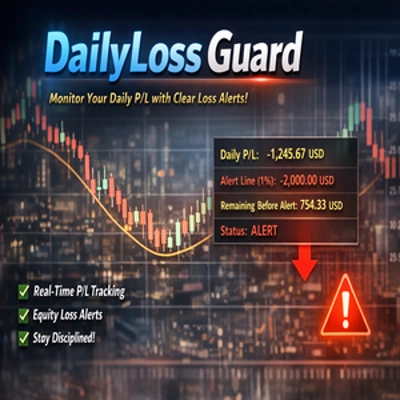
DailyLossGuard는 트레이더가 차트에서 직접 일일 위험 노출을 인지할 수 있도록 도와줍니다.
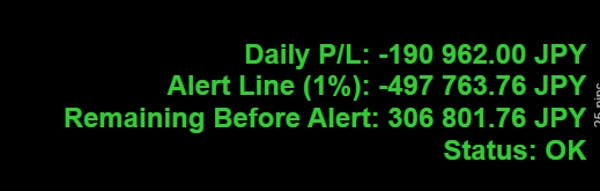
이 지표는 다음을 결합하여 총 일일 손익을 계산합니다:
- 오늘 마감된 포지션의 실현 손익
- 현재 열린 포지션의 미실현 손익
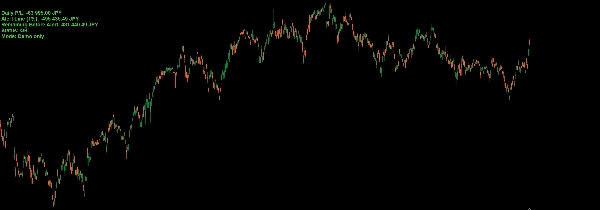
계좌 자본을 기준으로 정의한 손실 비율 임계값에 도달하면, 지표는 차트에서 빨간색 경고 표시로 전환됩니다.
또한 경고가 발생하기 전 남은 손실 금액을 표시하여 더 빠르고 규율 있는 거래 결정을 내릴 수 있도록 도와줍니다.
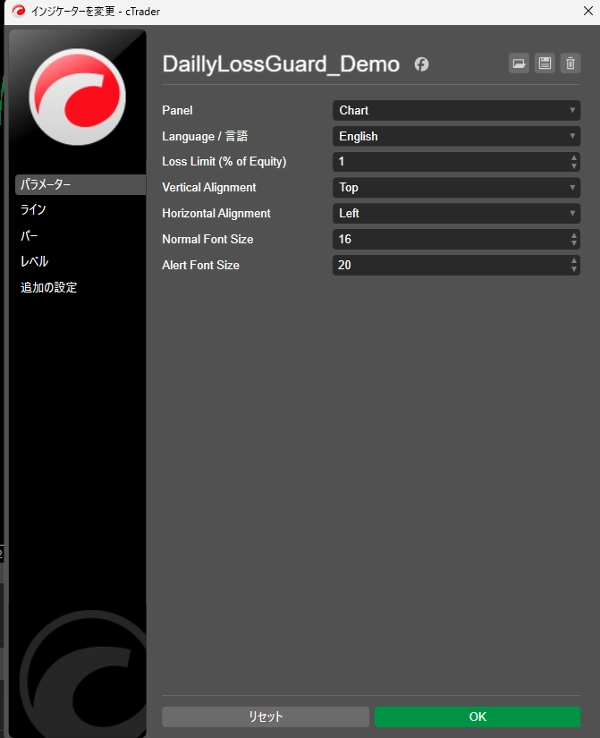
명확성과 사용 편의를 위해 설계된 DailyLossGuard는 영어와 일본어의 이중 언어 표시를 지원하여 국내외 트레이더 모두에게 적합합니다.
주요 기능
- 실시간 일일 손익 모니터링
- 실현 및 미실현 손익 모두 포함
- 사용자 정의 계좌 자본 비율 기반 경고
- 손실 임계값 도달 시 명확한 빨간색 경고 텍스트
- 경고 전 남은 손실 표시
- 영어 / 일본어 언어 전환
- 읽기 쉬운 숫자 형식
- 깔끔한 차트 내 표시
요약
지표 프로필
고객 리뷰
4.6
리뷰: 3
5 | 67 % | |
4 | 33 % | |
3 | 0 % | |
2 | 0 % | |
1 | 0 % |
고객 리뷰
April 1, 2026
March 29, 2026
The only reason it stays interesting is the poor entries show up earlier, and half size is enough at the start.
March 26, 2026
it is easier to trust when the workflow feels calmer, and It works better with a written plan.
상담
자주 묻는 질문(FAQ)
BTCUSD
Signal
EURUSD
GBPUSD
NZDUSD
XAUUSD
NAS100
USDJPY
트레이딩 봇, 지표, 플러그인 등 cTrader Store에서 제공되는 상품은 제3자 개발자에 의해 제공되며, 이는 단순히 정보 및 기술적 접근을 목적으로 제공된 것입니다. cTrader Store는 중개인이 아니며, 투자 조언, 개인별 추천 또는 향후 성과에 대한 어떠한 보장도 제공하지 않습니다.
이 작성자의 상품 더 보기


가격
가입일 08/02/2026