
HIO Mutil Currency CCI Scanner
Indikator
Versi 1.0, May 2026
Windows, Mac
4.5
Ulasan: 2
Deskripsi
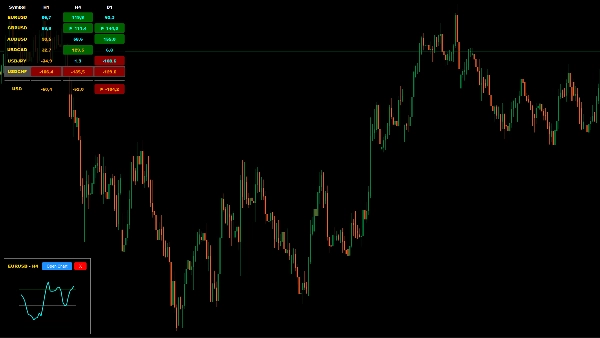
The HIO Multi-Currency CCI Scanner adalah indikator cTrader khusus yang dirancang untuk mengoptimalkan ruang kerja trading Anda. Alih-alih berpindah antara beberapa grafik terbuka, indikator ini menyediakan dasbor terpusat untuk memantau nilai Commodity Channel Index (CCI) di berbagai simbol dan kerangka waktu secara bersamaan. Ini dibuat untuk membantu trader mengidentifikasi potensi ekstrem pasar dan kelanjutan tren dari satu panel.
Fitur Utama
- Matriks Multi-Simbol & Kerangka Waktu: Pantau simbol dan kerangka waktu yang ditentukan pengguna dalam satu panel terpadu pada grafik cTrader Anda.
- Perhitungan Kekuatan Mata Uang: Menampilkan meter terintegrasi yang memperkirakan kekuatan mata uang target menggunakan algoritma CCI berbobot volume.
- Mini-Grafik Interaktif: Klik pada sel data mana pun di dalam dasbor untuk membuka mini-grafik mengambang, memungkinkan Anda melihat garis CCI secara rinci tanpa meninggalkan ruang kerja utama Anda.
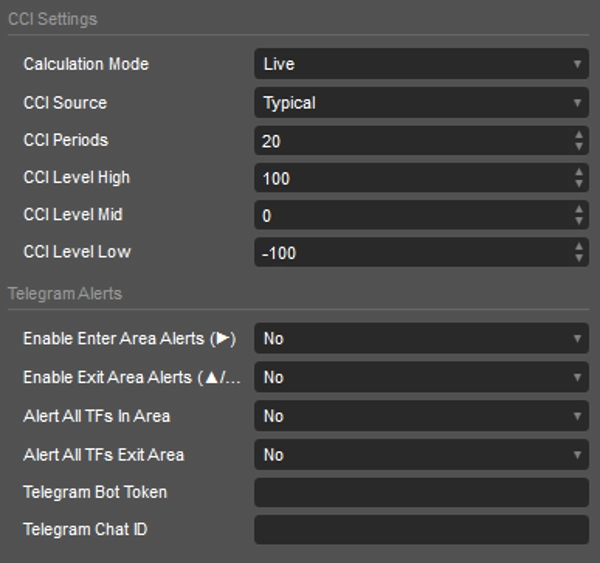
- Peringatan Telegram Terintegrasi: Hubungkan Bot Telegram Anda untuk menerima notifikasi saat kerangka waktu individu—atau konfluensi semua kerangka waktu—masuk atau keluar dari zona ekstrem yang telah Anda tetapkan.
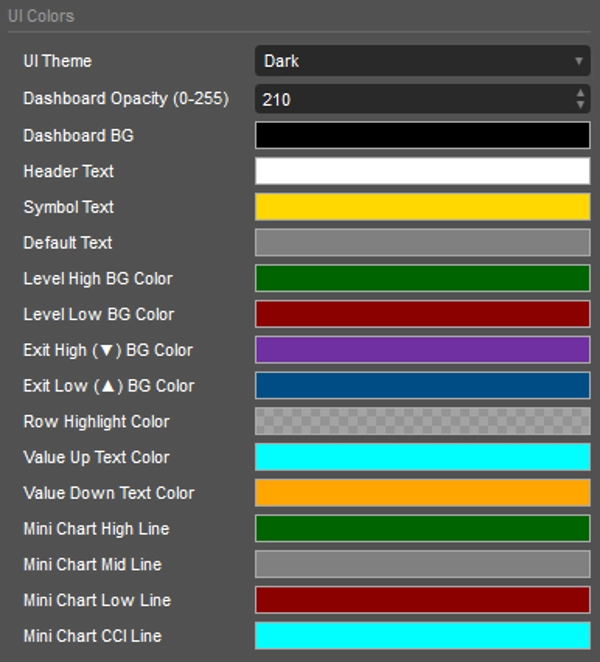
- UI yang Dapat Disesuaikan: Desain yang sepenuhnya adaptif dengan tema warna Terang, Gelap, atau Kustom untuk integrasi mulus dengan lingkungan cTrader pilihan Anda.
Pengaturan & Parameter
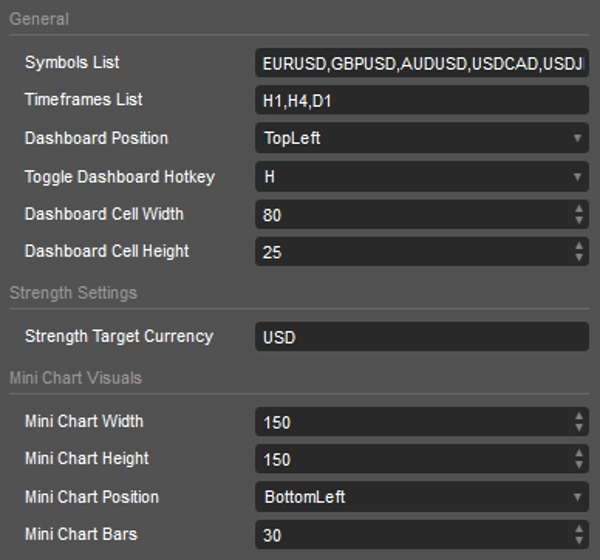
- Simbol & Kerangka Waktu: Masukkan aset dan kerangka waktu yang Anda inginkan menggunakan nilai yang dipisahkan koma (misalnya, EURUSD, GBPUSD dan h1, h4, d1).
- Mata Uang Target: Tentukan mata uang dasar (misalnya, USD) untuk perhitungan meter kekuatan.
- Pengaturan CCI: Sesuaikan parameter inti termasuk Mode Perhitungan (Live/Bar Close), Sumber Data (misalnya, Close, High, Low), Periode, dan ambang batas Overbought/Oversold tertentu.
- Konfigurasi Peringatan: Masukkan Token Bot Telegram dan ID Obrolan Anda untuk mengaktifkan notifikasi push jarak jauh.
Legenda Dasbor (Warna & Simbol)
Dasbor menggunakan petunjuk visual untuk dengan cepat menyampaikan data momentum:
- Latar Belakang Hijau Tua: CCI saat ini berada di zona Overbought.
- Latar Belakang Merah Tua: CCI saat ini berada di zona Oversold.
- Latar Belakang Ungu/Biru: CCI sedang aktif menyeberang keluar dari zona ekstrem.
- ▶ (Masuk): Momentum sedang aktif memasuki ambang ekstrem.
- ▼ (Turun/Keluar): Keluar dari area Overbought, menandakan potensi momentum turun.
- ▲ (Naik/Keluar): Keluar dari area Oversold, menandakan potensi momentum naik.
Catatan: Alat ini dirancang untuk tujuan analitis guna membantu alur kerja analisis teknis Anda dalam cTrader.
Ringkasan
Profil indikator
Kategori indikator
Momentum
Tipe output
Visualisasi
Sinyal
Filter
Persyaratan data
Hanya batang
Data tick
Volume
Sinyal yang didukung
Cross
Divergen
Kekuatan tren
Volatilitas
Level tersentuh
Level tertembus
Reversal
Ulasan pelanggan
4.5
Ulasan: 2
5 | 50 % | |
4 | 50 % | |
3 | 0 % | |
2 | 0 % | |
1 | 0 % |
Diskusi
Pertanyaan umum
Volume
CCI
Produk-produk yang tersedia melalui cTrader Store, termasuk bot trading, indikator, dan plugin, disediakan oleh pengembang pihak ketiga serta hanya ditujukan untuk akses teknis dan informasi. cTrader Store bukan broker dan tidak menyediakan saran investasi, rekomendasi pribadi, atau jaminan apa pun tentang kinerja di masa mendatang.
Produk lain dari penulis ini


![Logo "[Hamster-Coder] Bollinger Bands"](https://cdn.ctrader.com/image/webp/21d8e5d6-fb11-4bac-b9ee-cd05c2b76804_30327)


Harga
Sejak 12/06/2025
1
Penjualan
317
Instal gratis