

Deskripsi
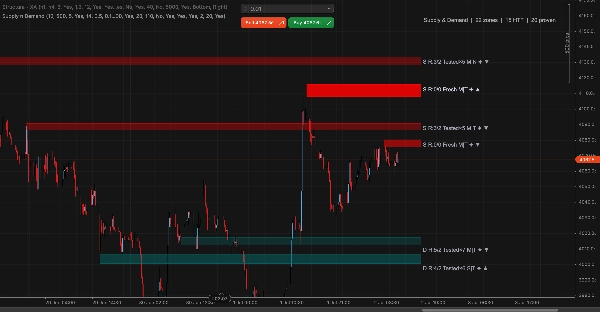
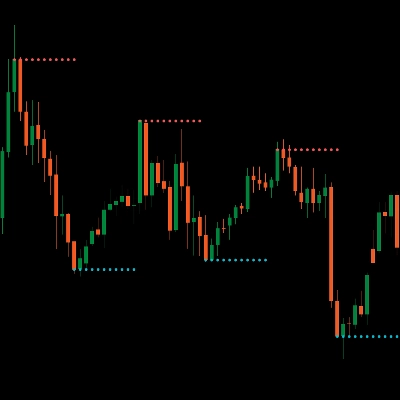
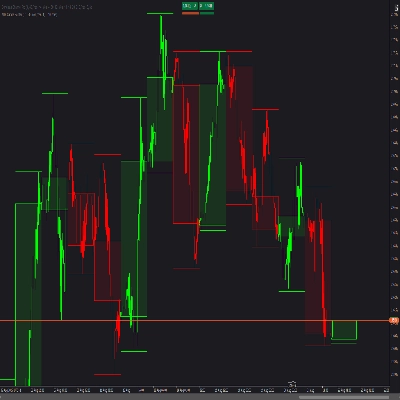
Deteksi zona Supply dan Demand dari pivot ayunan, dengan konfluensi multi-timeframe dan penyaringan volume. Zona memproyeksikan 20 bar ke depan dan melacak setiap retest dan breakout - opasitas zona memudar seiring bertambahnya usia, zona yang konfluensi MTF mendapatkan border solid, dan pembalikan peran membalik zona yang pecah ke sisi yang berlawanan.
Setiap zona memiliki label ringkas dengan semua sinyal kualitas: tipe S/D, hitungan retest/breakout, kesegaran (Fresh/Tested×N), eksplosivitas (Kuat/Sedang/Lemah), keketatan basis (Ketat/Normal/Lebar), konfluensi HTF (✦), dan volume saat pembentukan (▲/▼). Zona Fresh + ✦ + ▲ adalah kualitas tertinggi - belum tersentuh, dikonfirmasi oleh struktur H4, dan terbentuk pada volume tinggi.
➤ FITUR
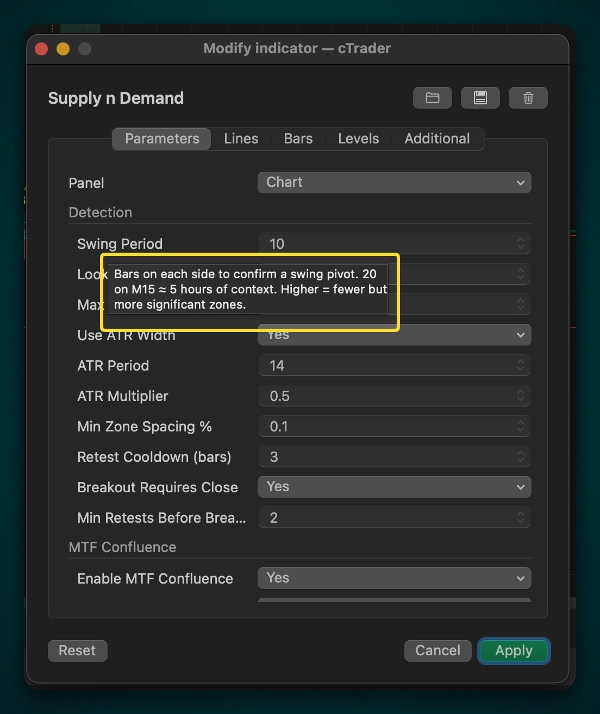
• Deteksi pivot ayunan dengan periode yang dapat dikonfigurasi (default 20 pada M15)
• Gerbang keras HTF H4 — hanya zona yang tumpang tindih dengan struktur H4 yang dibuat (opsional)
• Perlindungan multi-sentuhan — zona harus bertahan dari N retest sebelum breakout dihitung
• Penyaring volume — zona yang terbentuk pada volume tick di atas rata-rata mendapatkan tag ▲
• Pembalikan zona / pembalikan peran — Supply yang pecah menjadi Demand (dan sebaliknya)
• Pudar visual — opasitas berkurang dengan sentuhan; persentase pudar global mengontrol transparansi
• Border batas TrendLine — dipotong sesuai jangkauan zona, lebih kuat untuk zona HTF
• Dashboard ringkas — hitungan zona, hitungan HTF, hitungan zona terbukti di kanan atas
• Pelestarian zona terbukti — zona dengan 3+ sentuhan tidak pernah kedaluwarsa
➤ GRUP PARAMETER
Deteksi — Periode Ayunan, pengali/ukuran ATR, aturan breakout, cooldown retest
Konfluensi MTF — referensi H4, toggle gerbang keras HTF, ayunan/lookback HTF
Konfluensi Volume — MA volume, persentase ambang, penekanan volume rendah
Gaya — warna, ketebalan border, visibilitas label
Visual — persentase pudar global, toggle dashboard
➤ ALUR KERJA TRADING
1. Identifikasi zona berkualitas tinggi: Fresh, ✦, ▲, basis Ketat
2. Tunggu harga mencapai zona — JANGAN masuk hanya dengan sentuhan
3. Tunggu konfirmasi candle (engulfing, pin bar, hammer di Demand; shooting star, engulfing di Supply)
4. Stop loss di luar batas zona + buffer; TP di zona lawan berikutnya
5. Untuk pembalikan: tunggu retest SETELAH breakout, lalu candle konfirmasi
➤ PENGATURAN YANG DIREKOMENDASIKAN
• Scalping (M1-M5): Ayunan=8, ATR=1.0, HTF=H1, RequireHTF=false
• Intraday (M15-M30): Ayunan=20, ATR=1.5, HTF=H4, RequireHTF=true (default)
• Swing (H1-D1): Ayunan=20, ATR=2.0, HTF=D1/W1, RequireHTF=true
➤ MEMBACA LABEL
Setiap zona memiliki label di tepi kanannya dengan info kualitas yang dipadatkan. Contoh: S R:3/2 Tested×5 M|N ✦ ▼
Rincian
- S / D - Supply (resistensi) atau Demand (dukungan)
- R:3/2 - Retest:3 / Breakout:2 — zona bertahan 3 kali, pecah 2 kali
- Tested×5 - Total sentuhan (retest + breakout = 5) — indikator kesegaran
- M|N - Eksplosivitas|Basis: M=Sedang, N=Lebar basis Normal
- ✦ - Konfluensi HTF dikonfirmasi — zona tumpang tindih dengan zona H4 tipe yang sama
- ▼ / ▲ - Volume saat pembentukan: ▲=di atas rata-rata (kuat), ▼=di bawah rata-rata (lebih lemah)
Cara Membaca Zona Sekilas
- Fresh + ✦ + ▲ — kualitas tertinggi: belum tersentuh, dikonfirmasi oleh timeframe lebih tinggi, terbentuk pada volume tinggi
- Tested×5-7 — zona telah diuji berkali-kali, probabilitas bertahan menurun dengan setiap sentuhan
- Semakin transparan (pudar) sebuah zona — semakin rendah volume pembentukan atau semakin banyak sentuhannya. Alpha visual langsung menunjukkan zona mana yang "terpakai"
Indikator ini hanya untuk analisis. Ini tidak melakukan trading. Selalu uji di akun demo sebelum live.
Ringkasan
Each zone features a compact label displaying key quality signals: zone type (Supply or Demand), retest and breakout counts, freshness, explosiveness, base tightness, higher timeframe confluence, and volume at formation. Zones formed on above-average tick volume and confirmed by H4 structure are marked as highest quality.
Key features include configurable swing pivot detection, optional H4 hard gate filtering, multi-touch protection requiring zones to survive multiple retests before breakout recognition, volume-based filtering, visual fading of zones with age or touches, and preservation of proven zones with three or more touches. A compact dashboard shows zone counts and quality metrics.
Parameters cover detection settings, multi-timeframe and volume confluence, visual style, and dashboard options. Recommended settings vary by trading style, from scalping to swing trading. The indicator provides visual support and resistance levels with detailed quality metrics for analysis but does not execute trades.
Diskusi
Ulasan pelanggan
5 | 100 % | |
4 | 0 % | |
3 | 0 % | |
2 | 0 % | |
1 | 0 % |

Pertanyaan umum






Harga