
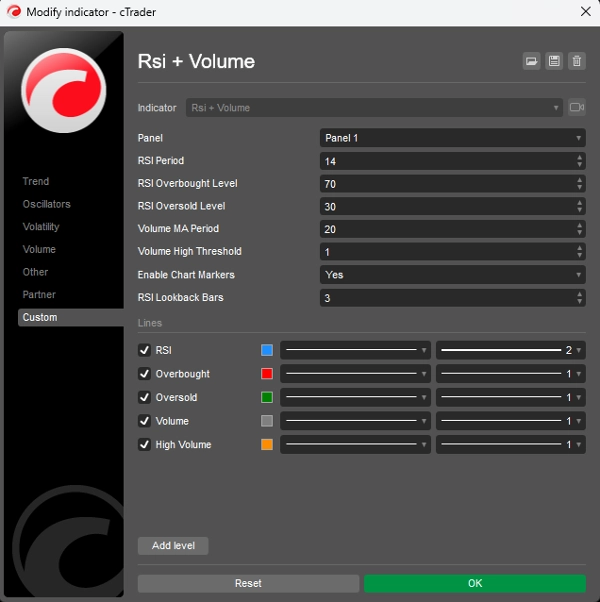
Rsi + Volume
Indikator
707 unduhan
Versi 1.0, Mar 2025
Windows, Mac
5.0
Ulasan: 3
Deskripsi
Indikator ini menggabungkan RSI (Relative Strength Index) dengan analisis volume untuk menghasilkan sinyal perdagangan yang lebih dapat diandalkan. Ini bekerja berdasarkan prinsip bahwa pergerakan harga yang signifikan harus disertai dengan volume tinggi untuk mengonfirmasi kekuatan pergerakan tersebut.
Komponen Utama:
- Analisis RSI:
-
- Mengukur kecepatan dan perubahan pergerakan harga pada skala 0-100
- Mengidentifikasi kondisi jenuh beli (di atas 70) dan jenuh jual (di bawah 30)
- Membantu mendeteksi titik pembalikan potensial di pasar
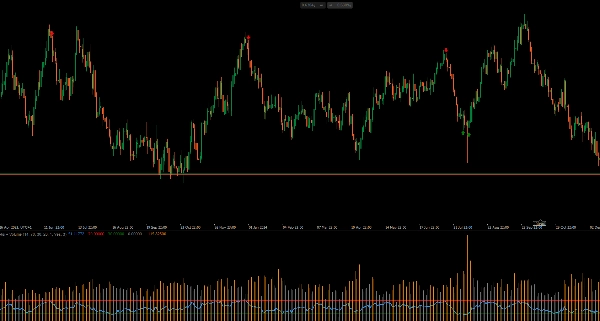
- Analisis Volume:
-
- Membandingkan volume saat ini dengan rata-rata bergerak dari volume terbaru
- Menyoroti periode volume tinggi (batang histogram oranye)
- Mengonfirmasi kekuatan di balik pergerakan harga
- Pembuatan Sinyal:
-
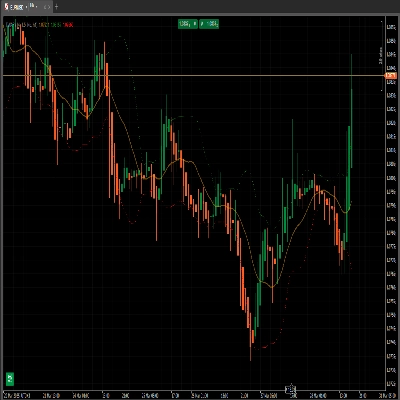
- Sinyal Beli: Ketika RSI melintasi di atas level jenuh jual (30) dengan volume tinggi
- Sinyal Jual: Ketika RSI melintasi di bawah level jenuh beli (70) dengan volume tinggi
- Sinyal visual muncul langsung di grafik (panah hijau ke atas untuk beli, panah merah ke bawah untuk jual)
Cara Menggunakannya:
- Cari sinyal beli saat harga dalam tren turun dan RSI menunjukkan kondisi jenuh jual
- Cari sinyal jual saat harga dalam tren naik dan RSI menunjukkan kondisi jenuh beli
- Volume yang lebih tinggi mengonfirmasi kekuatan sinyal
- Sesuaikan parameter (periode RSI, ambang volume) agar sesuai dengan kerangka waktu perdagangan Anda
Indikator ini membantu menyaring sinyal palsu dengan mengharuskan konfirmasi RSI dan volume di atas rata-rata, sehingga lebih dapat diandalkan dibandingkan menggunakan RSI saja.
Ringkasan
Ringkasan AI
The "Rsi + Volume" indicator integrates the Relative Strength Index (RSI) with volume analysis to enhance the reliability of trading signals. It operates on the principle that significant price movements should be confirmed by high trading volume.
Key components include:
1. RSI Analysis:
- Measures the speed and change of price movements on a 0-100 scale.
- Identifies overbought conditions (above 70) and oversold conditions (below 30).
- Helps detect potential market reversal points.
2. Volume Analysis:
- Compares current volume against a moving average of recent volume.
- Highlights periods of high volume using orange histogram bars.
- Confirms the strength behind price movements.
Signal generation occurs when RSI crosses key thresholds with accompanying high volume:
- Buy signals trigger when RSI rises above the oversold level (30) with high volume.
- Sell signals trigger when RSI falls below the overbought level (70) with high volume.
Visual signals appear directly on the chart as green up arrows for buys and red down arrows for sells.
Users can adjust parameters such as RSI period and volume threshold to fit their trading timeframe. This indicator aims to filter out false signals by requiring both RSI confirmation and above-average volume, providing more dependable trade signals than RSI alone.
Profil indikator
Ulasan pelanggan
5.0
Ulasan: 3
5 | 100 % | |
4 | 0 % | |
3 | 0 % | |
2 | 0 % | |
1 | 0 % |
Ulasan pelanggan
October 12, 2025
Hello, the RSI +volume indicator is perfect, but it needed to have something: when the little arrow appears on the chart, it could show a notification or an alarm. Would you be able to add that alarm or notification in cTrader?
August 12, 2025
Pros: Combines RSI and volume for stronger trading signals. Works well when RSI threshold intersects with high volume spikes. Lightweight and clear visuals. Cons: No alerts or tooltips. Lacks template saving. May generate noise on low-volume timeframes without additional filters.
Diskusi
Pertanyaan umum
Signal
Indices
RSI
Produk-produk yang tersedia melalui cTrader Store, termasuk bot trading, indikator, dan plugin, disediakan oleh pengembang pihak ketiga serta hanya ditujukan untuk akses teknis dan informasi. cTrader Store bukan broker dan tidak menyediakan saran investasi, rekomendasi pribadi, atau jaminan apa pun tentang kinerja di masa mendatang.


![Logo "[CB] Pivot Points Pro"](https://cdn.ctrader.com/image/webp/43463c82-67b0-4f10-a4ba-901bba091d81_32594)


Harga
Sejak 21/02/2025
466.3M
Volume trading
180.83K
Pip dimenangkan
22
Penjualan
6.82K
Instal gratis