
Deskripsi
Indikator Dark Cloud Cover adalah alat analisis teknikal yang dirancang untuk mengidentifikasi pola pembalikan bearish potensial di pasar. Pola ini terdiri dari dua candlestick berturut-turut:
- Sebuah candle bullish (hijau) yang menandakan momentum pembelian yang kuat.
- Sebuah candle bearish (merah) yang dibuka di atas penutupan sebelumnya tetapi ditutup di bawah titik tengah candle sebelumnya, menunjukkan tekanan jual.
Formasi ini menunjukkan potensi perubahan sentimen pasar, di mana pembeli kehilangan kendali dan penjual mengambil alih.
Fitur & Fungsionalitas:
- Deteksi Pola:
-
- Indikator memindai pola Dark Cloud Cover berdasarkan aksi harga candlestick.
- Saat terdeteksi, pola tersebut secara visual disorot untuk memberi peringatan kepada trader.
- Filter Tren (Opsional):
-
- Untuk meningkatkan akurasi, indikator menyertakan filter tren opsional menggunakan Moving Average (MA).
- Jika diaktifkan, pola hanya dianggap valid saat terjadi dalam tren naik.
- Logika Konfirmasi:
-
- Indikator dapat memvalidasi sinyal bearish dengan memeriksa candle berikutnya.
- Sebuah candle konfirmasi diidentifikasi jika ditutup di bawah Dark Cloud Cover low dan memiliki volume tick lebih tinggi daripada rata-rata candle terbaru.
- Ini memastikan keandalan sinyal yang lebih kuat.
- Penanda Visual:
-
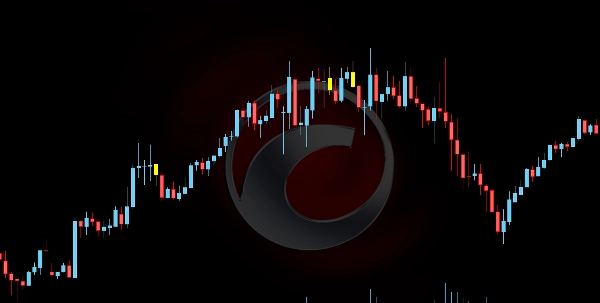
- Candle Kuning: Menandai pola Dark Cloud Cover yang terdeteksi.
- Candle Oranye: Menyoroti candle konfirmasi jika kondisi volume terpenuhi.
Indikator ini membantu trader mengenali setup pembalikan dengan probabilitas tinggi, meningkatkan pengambilan keputusan untuk entri pendek atau strategi manajemen risiko.
Ringkasan
Ringkasan AI
The Dark Cloud Cover indicator is a technical analysis tool that identifies a specific bearish reversal candlestick pattern. This pattern consists of two candles: a bullish (green) candle indicating strong buying momentum, followed by a bearish (red) candle that opens above the previous close but closes below the midpoint of the prior candle, signaling selling pressure and a potential shift from buyers to sellers.
Key features include:
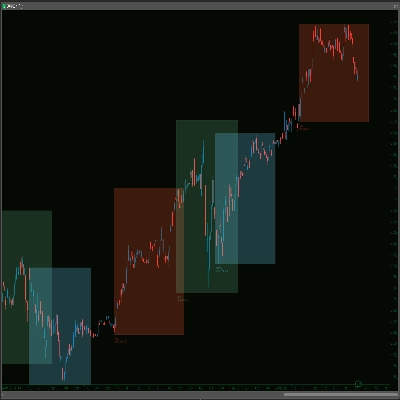
- **Pattern Detection:** Automatically scans for the Dark Cloud Cover pattern based on candlestick price action and visually highlights detected patterns for trader awareness.
- **Optional Trend Filter:** Incorporates a Moving Average (MA) filter to validate patterns only during uptrends, enhancing signal accuracy.
- **Confirmation Logic:** Validates bearish signals by analyzing the subsequent candle, which must close below the pattern’s low with higher-than-average tick volume to confirm the reversal.
- **Visual Markers:** Uses yellow candles to mark detected patterns and orange candles to highlight confirmation candles meeting volume criteria.
This indicator assists traders in recognizing high-probability bearish reversal setups, supporting decision-making for short entries and risk management strategies.
Key features include:
- **Pattern Detection:** Automatically scans for the Dark Cloud Cover pattern based on candlestick price action and visually highlights detected patterns for trader awareness.
- **Optional Trend Filter:** Incorporates a Moving Average (MA) filter to validate patterns only during uptrends, enhancing signal accuracy.
- **Confirmation Logic:** Validates bearish signals by analyzing the subsequent candle, which must close below the pattern’s low with higher-than-average tick volume to confirm the reversal.
- **Visual Markers:** Uses yellow candles to mark detected patterns and orange candles to highlight confirmation candles meeting volume criteria.
This indicator assists traders in recognizing high-probability bearish reversal setups, supporting decision-making for short entries and risk management strategies.
Profil indikator
Ulasan pelanggan
0.0
Ulasan: 0
Ulasan pelanggan
Belum ada ulasan untuk produk ini. Sudah mencobanya? Jadilah pemberi ulasan pertama!
Diskusi
Pertanyaan umum
Signal
Produk-produk yang tersedia melalui cTrader Store, termasuk bot trading, indikator, dan plugin, disediakan oleh pengembang pihak ketiga serta hanya ditujukan untuk akses teknis dan informasi. cTrader Store bukan broker dan tidak menyediakan saran investasi, rekomendasi pribadi, atau jaminan apa pun tentang kinerja di masa mendatang.
Produk lain dari penulis ini


Harga
5
Penjualan
436
Instal gratis