
Deskripsi
📌 Fitur & Fungsionalitas
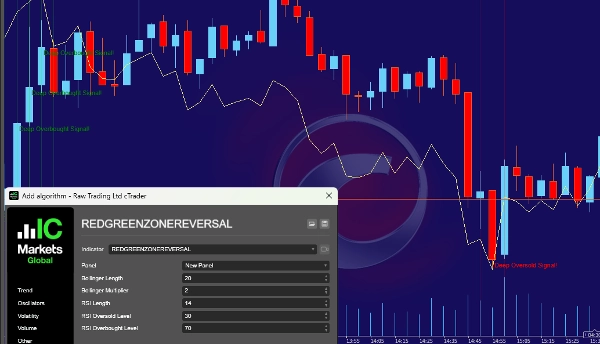
- Bollinger Bands (SMA 20-periode dengan deviasi standar 2)
-
- Pita atas: Menunjukkan level jenuh beli.
- Pita bawah: Menunjukkan level jenuh jual.
- Indeks Kekuatan Relatif (RSI) (14-periode)
-
- RSI di atas 70 → Pasar dalam kondisi jenuh beli (tekanan beli berlebihan).
- RSI di bawah 30 → Pasar dalam kondisi jenuh jual (tekanan jual berlebihan).
- Mendeteksi zona pembalikan:
-
- Zona Merah (Jenuh Jual):
-
- Harga penutupan berada di bawah Bollinger Band bawah.
- RSI di bawah 30 (tekanan jual kuat).
- Arti: Pasar dalam kondisi jenuh jual, peluang beli potensial.
- Zona Hijau (Jenuh Beli):
-
- Harga penutupan berada di atas Bollinger Band atas.
- RSI di atas 70 (tekanan beli kuat).
- Arti: Pasar dalam kondisi jenuh beli, peluang jual potensial.
- Penanda grafik visual:
-
- Zona berbayang merah saat jenuh jual (peluang beli potensial).
- Zona berbayang hijau saat jenuh beli (peluang jual potensial).
- Peringatan & Sinyal Suara:
-
- Teks muncul di grafik (“Sinyal Jenuh Jual Dalam!” atau “Sinyal Jenuh Beli Dalam!”).
- Notifikasi suara diputar saat kondisi jenuh beli/jual terdeteksi.
🎯 Bagaimana indikator ini membantu trader?
✅ Memberikan sinyal peringatan untuk potensi pembalikan pasar (pada level harga ekstrem).
✅ Membantu trader menemukan titik masuk dan keluar yang kuat.
✅ Menggabungkan Bollinger Bands dan RSI untuk deteksi jenuh beli/jual yang andal.
✅ Cocok untuk day trading, swing trading, dan scalping pada berbagai timeframe.
🚀 Ringkasan:
Indikator ini membantu mengidentifikasi kondisi jenuh beli dan jenuh jual dan memberi peringatan ketika pembalikan harga kemungkinan terjadi. Trader dapat menggunakan ini untuk mengambil keputusan beli dan jual yang cerdas!
🚨 Penafian Risiko Perdagangan 🚨
Perdagangan instrumen keuangan, termasuk saham, forex, cryptocurrency, komoditas, dan derivatif, melibatkan tingkat risiko tinggi dan tidak cocok untuk semua investor. Sebelum terlibat dalam bentuk perdagangan apa pun, penting untuk memahami risiko yang terlibat dan mempertimbangkan dengan cermat situasi keuangan, pengalaman, dan toleransi risiko Anda.
Pasar bisa sangat volatil, dan pergerakan harga bisa tiba-tiba dan tidak terduga akibat rilis data ekonomi, peristiwa geopolitik, sentimen pasar, atau berita tak terduga. Volatilitas ini dapat menghasilkan keuntungan besar, tetapi juga kerugian signifikan. Pasar dapat bergerak berlawanan dengan posisi Anda dengan cepat, stop-loss dan strategi manajemen risiko tidak menjamin pencegahan kerugian, dan leverage dapat memperbesar keuntungan maupun kerugian, yang berpotensi melebihi investasi awal Anda.
Tidak ada jaminan bahwa strategi perdagangan, indikator teknikal, atau metode apa pun akan menghasilkan keuntungan. Kinerja historis tidak menjamin hasil di masa depan, dan keberhasilan masa lalu tidak memastikan keuntungan di masa depan. Bahkan trader profesional mengalami kerugian, kondisi pasar berubah terus-menerus, dan memprediksi pergerakan masa depan dengan kepastian adalah hal yang mustahil. Perdagangan tidak boleh didasarkan hanya pada spekulasi atau emosi.
Menggunakan leverage atau perdagangan margin memungkinkan Anda mengendalikan posisi yang lebih besar dengan investasi modal yang lebih kecil, tetapi ini juga secara signifikan meningkatkan risiko. Leverage dapat menyebabkan kehilangan modal dengan cepat, margin call dapat memaksa likuidasi posisi pada harga yang tidak menguntungkan, dan perdagangan margin dapat mengakibatkan kehilangan lebih banyak uang daripada yang disetorkan awal. Selain itu, risiko likuiditas dan slippage dapat terjadi, artinya mungkin tidak ada cukup pembeli atau penjual pada waktu tertentu, dan order mungkin tidak dieksekusi pada harga yang diharapkan. Celah pasar dapat menyebabkan lonjakan harga tiba-tiba, melewati level stop-loss sepenuhnya.
Perdagangan membutuhkan disiplin, kesabaran, dan pengendalian emosi. Ketakutan, keserakahan, dan kepercayaan diri berlebihan sering menyebabkan keputusan perdagangan yang buruk, meningkatkan kemungkinan kerugian. Perdagangan emosional dapat mengakibatkan keputusan impulsif dan tidak rasional, sementara ketakutan kehilangan kesempatan (FOMO) dan perdagangan balas dendam dapat menyebabkan pengambilan risiko berlebihan. Mengembangkan strategi yang jelas dan mematuhi rencana manajemen risiko sangat penting.
Risiko regulasi dan hukum juga harus dipertimbangkan, karena yurisdiksi yang berbeda memiliki regulasi berbeda terkait perdagangan dan investasi. Beberapa produk keuangan mungkin tidak tersedia di negara Anda, dan perubahan regulasi dapat memengaruhi kondisi pasar. Selalu pastikan kepatuhan terhadap hukum dan regulasi keuangan setempat, berdagang dengan broker atau bursa yang bereputasi dan teregulasi, dan hindari platform yang tidak teregulasi yang dapat menimbulkan risiko keuangan signifikan.
Risiko terkait teknologi tidak boleh diabaikan, karena perdagangan sangat bergantung pada platform perdagangan, konektivitas internet, dan eksekusi perangkat lunak. Eksekusi tertunda akibat internet lambat atau masalah server dapat menyebabkan kerugian tak terduga, kegagalan sistem dapat menyebabkan posisi tetap terbuka lebih lama dari yang diinginkan, dan risiko keamanan siber ada saat menggunakan platform perdagangan online.
Penting untuk dicatat bahwa semua informasi perdagangan, indikator, sinyal, atau alat hanya untuk tujuan edukasi dan tidak boleh dianggap sebagai nasihat keuangan. Trader harus melakukan riset sendiri dan, jika perlu, berkonsultasi dengan penasihat keuangan berlisensi sebelum membuat keputusan investasi. Tidak ada indikator atau strategi yang menjamin profitabilitas konsisten, dan tanggung jawab atas semua keputusan perdagangan sepenuhnya ada pada trader individu.
Aturan paling penting dalam perdagangan adalah jangan pernah berdagang dengan uang yang Anda tidak mampu kehilangan. Perdagangan secara inheren berisiko, dan kerugian dapat melebihi investasi awal. Berdaganglah hanya dengan pendapatan yang bisa Anda relakan untuk hilang, jangan pernah menggunakan uang pinjaman atau biaya hidup penting, dan diversifikasikan investasi Anda untuk menghindari menaruh semua dana pada satu perdagangan atau aset.
Perdagangan adalah aktivitas berisiko tinggi dan tidak boleh diandalkan sebagai sumber pendapatan utama. Banyak trader mengalami kerugian, dan hanya sebagian kecil yang mencapai profitabilitas jangka panjang. Buat keputusan yang tepat, kelola risiko, dan selalu berdagang dengan bertanggung jawab. Dengan menggunakan platform, alat, atau indikator perdagangan apa pun, Anda mengakui dan menerima risiko yang terkait dengan perdagangan.
Berdaganglah dengan bijak. Tetap terinformasi. Lindungi modal Anda. 🚀
Ringkasan
- Red Zone (Oversold): Closing price below the lower Bollinger Band and RSI below 30, signaling strong selling pressure and a potential buying opportunity.
- Green Zone (Overbought): Closing price above the upper Bollinger Band and RSI above 70, indicating strong buying pressure and a potential selling opportunity.
Visual markers include red-shaded zones for oversold conditions and green-shaded zones for overbought conditions. Alerts are provided via on-chart text notifications ("Deep Oversold Signal!" or "Deep Overbought Signal!") and sound signals when these conditions occur.
This tool assists traders by providing warning signals for potential market reversals at extreme price levels, helping to identify strong entry and exit points. It is suitable for various trading styles, including day trading, swing trading, and scalping, across different timeframes. The indicator supports markets such as forex, stocks, indices, and commodities.
Ulasan pelanggan
5 | 100 % | |
4 | 0 % | |
3 | 0 % | |
2 | 0 % | |
1 | 0 % |


![Logo "[Stellar Strategies] MARSI Signal Plotter"](https://cdn.ctrader.com/image/webp/7b2b8da6-8f8e-4646-8d4a-4710c516c01e_25567)


![Logo "Gaussian Channel [Iridio Capital]"](https://cdn.ctrader.com/image/webp/7c039209-5573-4a54-a072-f9528b503103_41960)


