설명
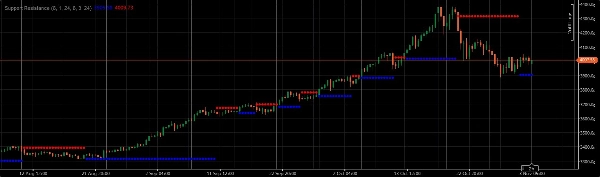
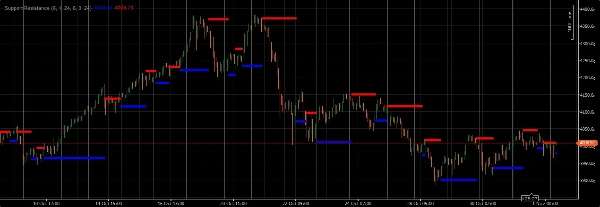
금 거래 시, 다양한 시간대(대형, 범위, 틱 차트)의 지지선과 저항선을 사용하여 잠재적인 피벗 돌파 또는 지지/저항 지점을 식별하세요. 이러한 신호는 이동평균선, 오실레이터, 캔들스틱 패턴과 같은 다른 기술 지표로 항상 확인하여 더 높은 확률의 거래를 하십시오
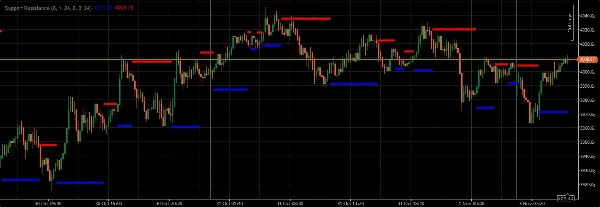
금 거래 시, 다양한 시간대(대형, 범위, 틱 차트)의 지지선과 저항선을 사용하여 잠재적인 피벗 돌파 또는 지지/저항 지점을 식별하세요. 금 거래 시, 다양한 시간대(대형, 범위, 틱 차트)의 지지선과 저항선을 사용하여 잠재적인 피벗 돌파 또는 지지/저항 지점을 식별하세요. 일단 이러한 수준이 식별되면, 중요한 결정 지점으로 작용할 수 있습니다. 특히 몸통이 커진 캔들과 함께 저항선을 상향 돌파하거나 지지선을 하향 돌파하는 경우, 이는 추세의 지속 또는 시장 심리의 중요한 변화를 나타내는 신호인 경우가 많습니다. 반대로 지지선에서 반등하거나 저항선에서 거부되는 경우, 잠재적인 반전 또는 현재의 횡보 지속을 나타낼 수 있습니다. 이러한 신호는 이동평균선, 오실레이터, 캔들스틱 패턴과 같은 다른 기술 지표로 항상 확인하여 더 높은 확률의 거래를 하십시오. 또한 뉴스 이벤트와 경제 지표 발표에 주의를 기울이세요. 이는 금 가격에 큰 영향을 미치며 순수 기술적 설정을 무효화할 수 있습니다. 위험 관리는 매우 중요합니다; 단일 거래에 거래 자본의 소량 이상을 위험에 노출하지 마십시오.
요약
AI 요약
The Support Resistance indicator identifies key support and resistance levels across multiple timeframes, including large, range, and tick charts, primarily for trading gold (XAUUSD). It helps traders detect potential pivot breakouts or critical price points where price action may reverse or continue. Breakouts above resistance or below support, especially with strong candle bodies, can signal trend continuation or shifts in market sentiment. Conversely, price bounces or rejections at these levels may indicate reversals or consolidation phases. The indicator is designed to be used alongside other technical tools such as moving averages, oscillators, and candlestick patterns to improve trade signal reliability. It is applicable to various markets including Forex pairs like EURUSD, GBPUSD, NZDUSD, and USDJPY, as well as commodities like gold. Users are advised to consider fundamental factors like news and economic data releases, which can impact price behavior. The indicator supports strategies including breakout and scalping trading styles. Risk management principles are emphasized, recommending limited capital exposure per trade.
지표 프로필
고객 리뷰
5.0
리뷰: 2
5 | 100 % | |
4 | 0 % | |
3 | 0 % | |
2 | 0 % | |
1 | 0 % |
상담
자주 묻는 질문(FAQ)
Forex
Breakout
Scalping
EURUSD
Commodities
GBPUSD
NZDUSD
XAUUSD
ATR
USDJPY
트레이딩 봇, 지표, 플러그인 등 cTrader Store에서 제공되는 상품은 제3자 개발자에 의해 제공되며, 이는 단순히 정보 및 기술적 접근을 목적으로 제공된 것입니다. cTrader Store는 중개인이 아니며, 투자 조언, 개인별 추천 또는 향후 성과에 대한 어떠한 보장도 제공하지 않습니다.


가격
가입일 02/08/2025
39.95M
거래량
115.5K
핍 수익