AbsorptionRatio_AutoRiskPanel
مؤشر
الإصدار 1.0، Dec 2025
Windows, Mac
5.0
التقييمات: 1
الوصف
AbsorptionRatio_AutoRiskPanel يحول أي رمز في cTrader إلى لوحة تحكم نظام المخاطر الحي 🛰️.
بدلاً من الاعتماد على عدة صناديق تداول متداولة مثل نسبة الامتصاص متعددة الأصول الأصلية، يبني هذا المؤشر وكيل AR لرمز واحد مباشرة من حركة سعر الأداة التي تتداول بها:
- 📉 يحسب العوائد اللوغاريتمية للرمز الحالي.
- 🔗 يقيس الارتباط الذاتي للعوائد عبر عدة تأخيرات (1…7 أشرطة، حسب فترة الارتباط).
- 📊 يجمع متوسط الارتباط الذاتي المطلق ويرسمه في نسبة امتصاص معيارية بين 0.5 و 1.0 — القيم الأعلى تعني تركيزًا أكبر وسلوكًا أكثر تماسكًا.
- 🧬 ينعم الإشارة الخام باستخدام EMA، مما ينتج منحنى AR مستقر.
- 🧪 خلال نظرة إحصائية متحركة، يحسب:
-
- المتوسط و الانحراف المعياري لـ AR
- الـ Z-Score الحالي (كم عدد الانحرافات المعيارية فوق/تحت المتوسط)
- المرتبة المئوية لـ AR اليوم مقابل التاريخ
- 🤖 مع تمكين العتبات التلقائية، يقوم المؤشر باستمرار بمعايرة مستويات المخاطر ذاتيًا:
-
- مخاطر منخفضة ≈
المتوسط − 0.5σ - مخاطر عالية ≈
المتوسط + 0.5σ - مخاطر قصوى ≈
المتوسط + 1.5σ
يتم تقييد القيم ضمن[0…1]ويتم تحديثها شريطًا بشريط، لذا تتكيف الأنظمة مع كل رمز وإطار زمني.
- مخاطر منخفضة ≈
- 🧱 من هذه العتبات، AbsorptionRatio_AutoRiskPanel يحدد أربعة أنظمة ديناميكية:
-
- منخفض → بيئة متفرقة، سهلة / مخاطرة مفعلة
- عادي → ظروف متوازنة / محايدة
- مرتفع → تجمع مرتفع، ميول مخاطرة معطلة
- قصوى → بيئة متوترة، احتمال ارتفاع المخاطر النظامية 🛑
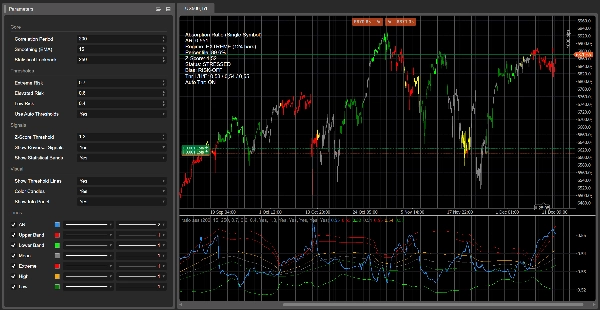
- 🕯️ في الرسم البياني الرئيسي، يمكن تلوين الشموع حسب المخاطر:
هذا يمنحك فلترًا بصريًا فوريًا: على سبيل المثال، تداول فقط دخول الاتجاه عندما لا تكون الشموع باللون الأحمر/البرتقالي، أو قلل الحجم خلال الأنظمة المتوترة. -
- 🔴 أحمر → AR متوتر إحصائيًا (Z-Score ≥ العتبة)
- 🟢 ليموني → AR هادئ إحصائيًا (Z-Score ≤ −العتبة)
- 🟧 / 🟡 برتقالي/أصفر → فوق العالي / قرب القصوى
- ⚪ رمادي → منطقة محايدة
- 💚 أخضر → AR منخفض، سلوك أكثر تفرقًا / مخاطرة مفعلة
- 🎯 إشارات اختيارية الارتداد نحو المتوسط في لوحة AR:
-
- 🟢 سهم شراء عندما يكون AR هادئًا إحصائيًا ويبدأ في الارتفاع
- 🔴 سهم بيع عندما يكون AR متوترًا إحصائيًا ويبدأ في الانخفاض
- 📋 لوحة معلومات مضغوطة في الزاوية العلوية اليسرى تعرض:
-
- القيمة الحالية لـ AR
- النظام النشط + المدة (عدد الأشرطة التي قضيت في هذا النظام)
- المرتبة المئوية، Z-Score و الحالة النوعية (متوتر / هادئ / عادي)
- الانحياز للمخاطر (مخاطرة مفعلة / مخاطرة معطلة / محايد)
- العتبات الفعالة منخفضة / عالية / قصوى المستخدمة وما إذا كانت العتبات التلقائية مفعلة أو معطلة
استخدم AbsorptionRatio_AutoRiskPanel لـ:
- تجنب التداول خلال أنظمة المخاطر المعطلة إحصائيًا
- تحديد البيئات الهادئة حيث قد تعمل الاختراقات أو متابعة الاتجاه بشكل أفضل
- وضع أي استراتيجية في سياق إطار نظام مخاطر ديناميكي بدلاً من استخدام فلاتر تقلب ثابتة.
⚙️ المعلمات (وثائق التخزين)
الأساسي ⚙️
- فترة الارتباط – طول نافذة الارتباط الذاتي. يتحكم في كمية التاريخ المستخدمة لتقدير نسبة الامتصاص. القيم الأكبر = نظام أكثر سلاسة و”ماكرو“؛ القيم الأصغر = أسرع ولكن أكثر ضوضاء.
- التنعيم (EMA) – فترة EMA المطبقة على إشارة AR الخام. القيم الأعلى تنعم تغييرات النظام، والقيم الأقل تجعل المؤشر أكثر تفاعلية.
- النظرة الإحصائية – فترة النظرة لـ AR المتوسط، الانحراف المعياري، Z-Score والمرتبة المئوية. تتحكم في سرعة تكيف الخط الأساسي الإحصائي.
العتبات 🚦
- مخاطر قصوى / مخاطر مرتفعة / مخاطر منخفضة – عتبات يدوية لأنظمة AR (منخفض / عادي / مرتفع / قصوى) تستخدم عندما تكون العتبات التلقائية معطلة. مع تفعيل العتبات التلقائية يتم تجاهلها للمنطق وتظهر فقط كإعدادات افتراضية.
- استخدام العتبات التلقائية – عند التفعيل، يتم اشتقاق العتبات من إحصائيات AR المتحركة:
-
- مخاطر منخفضة = المتوسط − 0.5σ
- مخاطر مرتفعة = المتوسط + 0.5σ
- مخاطر قصوى = المتوسط + 1.5σ
الإشارات 🎯
- عتبة Z-Score – الحد الأدنى لـ Z-Score المطلق لتصنيف AR كإحصائيًا قصوى. يدير تسميات متوتر/هادئ، تجاوزات الشموع، وأسهم الارتداد نحو المتوسط.
- عرض إشارات الانعكاس – تمكين/تعطيل أسهم الشراء/البيع في نافذة AR الفرعية.
- عرض الأشرطة الإحصائية – تبديل أشرطة ±2σ وخط المتوسط حول AR.
مرئي 🎨
- عرض خطوط العتبة – يعرض المستويات الفعالة المنخفضة / العالية / القصوى المستخدمة بواسطة محرك النظام (يدوي أو تلقائي).
- تلوين الشموع – يلون شموع السعر حسب Z-Score ومستوى النظام لتصور المخاطر الفوري.
- عرض لوحة المعلومات – يعرض لوحة النص في الزاوية العلوية اليسرى مع AR، النظام، الإحصائيات والانحياز.
الملخص
ملف تعريف المؤشر
تقييمات العملاء
5.0
التقييمات: 1
5 | 100 % | |
4 | 0 % | |
3 | 0 % | |
2 | 0 % | |
1 | 0 % |
تقييمات العملاء
December 20, 2025
the cleanest use is it makes weak ideas easier to leave alone, and It should stay in the support stack.
مناقشة
الأسئلة الشائعة
Signal
Indices
Commodities
GBPUSD
RSI
Bollinger
Fibonacci
Scalping
AI
XAUUSD
NAS100
MACD
BTCUSD
Forex
Breakout
EURUSD
NZDUSD
Martingale
Prop
ZigZag
Supertrend
Fair Value Gap
SMC
Crypto
Grid
Stocks
ATR
USDJPY
VWAP
يتم توفير المنتجات المتاحة من خلال cTrader Store، بما في ذلك روبوتات التداول والمؤشرات والإضافات، من قبل مطوري الطرف الثالث وإتاحتها لأغراض الوصول المعلوماتي والفني فقط. cTrader Store ليس وسيطًا ولا يقدم نصائح استثمارية أو توصيات شخصية أو أي ضمان للأداء المستقبلي.


السعر
42.11M
حجم التداول
6.13M
الربح بالبيب
224
المبيعات
8.42K
التثبيتات المجانية