Descrizione
Breve descrizione
Trend & Volume Regime Map è un filtro di regime per cTrader che misura la direzione e la persistenza sia del prezzo che del volume. Fornisce un punteggio di tendenza normalizzato e un punteggio di tendenza del volume nell'intervallo –10 a +10, colora le tue candele con una sfumatura graduale dal rosso ribassista al verde rialzista e mostra se l'ambiente attuale è risk-on, risk-off o semplicemente rumoroso.
🧠 Cosa fa
Questo indicatore replica la logica del “Regime Filter” di BigBeluga da TradingView, adattato per cTrader e racchiuso in una chiara mappa del regime di trend e volume.
Prezzo e volume smussati
- Calcola HLC3 (media di High, Low, Close) e applica una Hull Moving Average (HMA) per smussare il prezzo.
- Applica un'altra Hull Moving Average al volume tick.
Punteggio di tendenza (prezzo)
- Per le ultime N barre (
Length), confronta l'HMA corrente del prezzo con ogni valore HMA passato:
- Se HMA corrente > HMA passato → trend +1
- Se HMA corrente ≤ HMA passato → trend –1
- Il punteggio accumulato viene scalato a –10 … +10 → questo è il valore di Trend.
Punteggio di tendenza del volume
- Usa la stessa logica, ma applicata all'HMA del volume.
- Il risultato è un altro punteggio normalizzato in –10 … +10 → il valore di Volume.
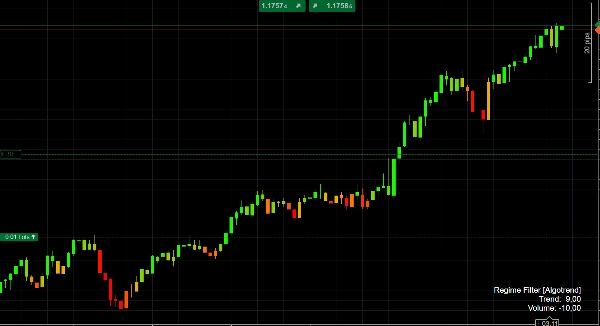
Logica del colore
- Quando il punteggio di Trend è negativo, le candele sono colorate con una sfumatura rosso → arancione a seconda di quanto è forte il regime ribassista.
- Quando il punteggio di Trend è positivo, le candele sono colorate arancione → lime, con un verde più intenso per regimi rialzisti più forti.
Questo ti dà un'indicazione visiva immediata se l'azione del prezzo è ribassista, neutra o rialzista, e quanto è persistente quel regime attualmente.
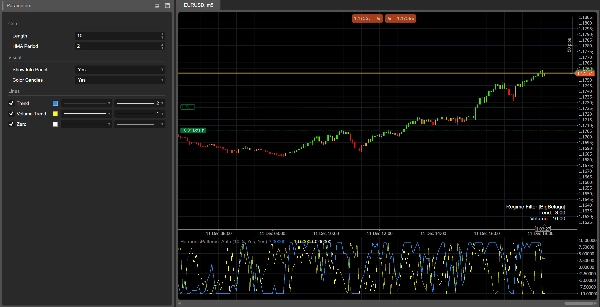
Pannello del regime
Nella finestra secondaria, l'indicatore traccia:
- Linea di Trend (blu)
- Linea di tendenza del Volume (grigia)
- Linea Zero (linea di base)
Sull'ultima barra stampa un piccolo pannello informativo con i valori correnti di Trend e Volume.
🎯 Come puoi usarlo
Conferma del trend
- Opera solo nella direzione di un regime forte, per esempio:
- Trend > +4 → bias solo long
- Trend < –4 → bias solo short
Filtro di regime
- Disattiva o riduci la scala della tua strategia quando il regime è debole (Trend vicino a 0) o quando la tendenza del Volume è fortemente negativa, che spesso segnala movimenti incerti o in calo.
Contesto per i segnali
Combina i tuoi segnali di ingresso esistenti (azione del prezzo, pattern armonici, oscillatori, ecc.) con Trend & Volume Regime Map come filtro macro:
- Prendi solo breakout quando il Trend è positivo e anche la tendenza del Volume è positiva.
- Evita configurazioni di mean-reversion quando il Trend è estremamente forte (> +8 o < –8), poiché il mercato è in un regime direzionale potente.
⚙️ Parametri di input
Nucleo
Length
Numero di barre usate per costruire i punteggi di trend e volume.
- Valori più alti → regime più “macro” e più liscio; più lento a cambiare ma più stabile.
- Valori più bassi → risposta più veloce, ma più rumore e cambi frequenti.
Periodo HMA
Periodo della Hull Moving Average usata per smussare sia il prezzo che il volume.
- Adattalo per abbinare il tuo timeframe e stile di trading: più corto per timeframe bassi, più lungo per timeframe alti.
Aspetto visivo
Mostra pannello info
Mostra/nasconde il piccolo pannello di testo sull'ultima barra con i punteggi correnti di Trend e Volume.Colora le candele
Abilita la colorazione delle candele basata sul valore di Trend (gradiente rosso / arancione / verde). Disattivalo se preferisci mantenere i colori predefiniti del grafico.
✅ Tabella di interpretazione rapida
- Trend ≥ +7 → regime rialzista forte, candele verde brillante.
- Trend tra +3 e +7 → bias rialzista; i ritracciamenti sono potenziali zone di acquisto.
- Trend tra –3 e +3 → laterale / incerto; i segnali sono meno affidabili.
- Trend ≤ –7 → regime ribassista forte, candele rosso scuro.
- Tendenza del volume > 0 → attività in crescita / sostenuta, i movimenti sono più probabilmente “reali” e persistenti.
- Tendenza del volume < 0 → partecipazione in calo, rischio maggiore di movimenti falsi, oscillazioni o inversioni.
Riepilogo
Recensioni dei clienti
5 | 0 % | |
4 | 100 % | |
3 | 0 % | |
2 | 0 % | |
1 | 0 % |


