
VMM PositionPivotPro
Indikator
Version 2.0, Jan 2026
Windows, Mac
Beschreibung
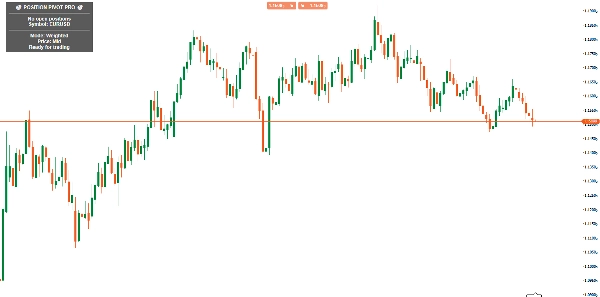
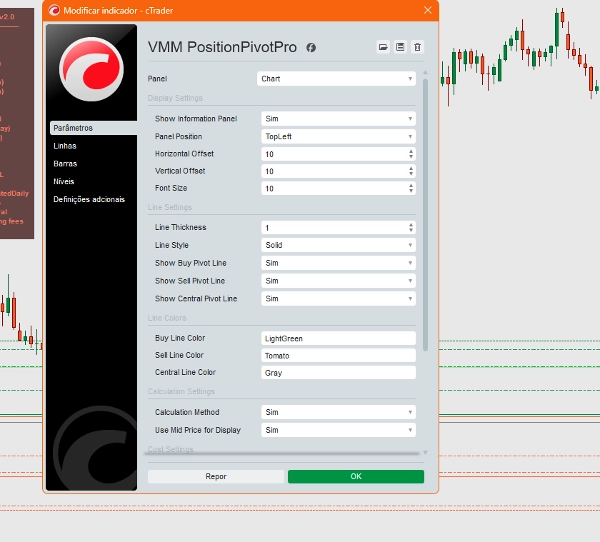
Position Pivot Pro ist ein fortschrittliches Positionsmanagement-Tool, das für Trader entwickelt wurde, die mehrere Einstiege auf dasselbe Asset tätigen. Der Indikator berechnet automatisch den durchschnittlichen Pivot-Punkt aller offenen Positionen und bietet eine wichtige visuelle Referenz im Chart.
Hauptmerkmale:
- Echtzeit-Pivot-Berechnung:
-
- Einfacher Durchschnitt: Arithmetisches Mittel der Einstiegspreise
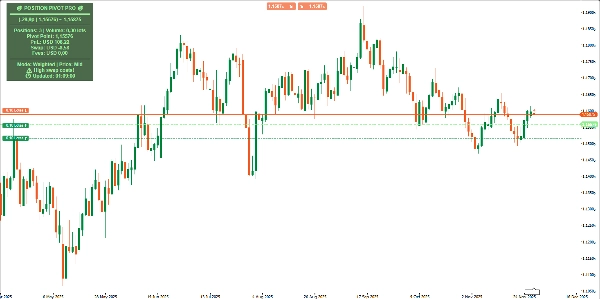
- Volumen-gewichteter Durchschnitt: (Standard) Berücksichtigt das Volumen jeder Position für genauere Pivots
- Dynamische Chartlinie, die sich automatisch anpasst
- Vollständiges Informationspanel:
-
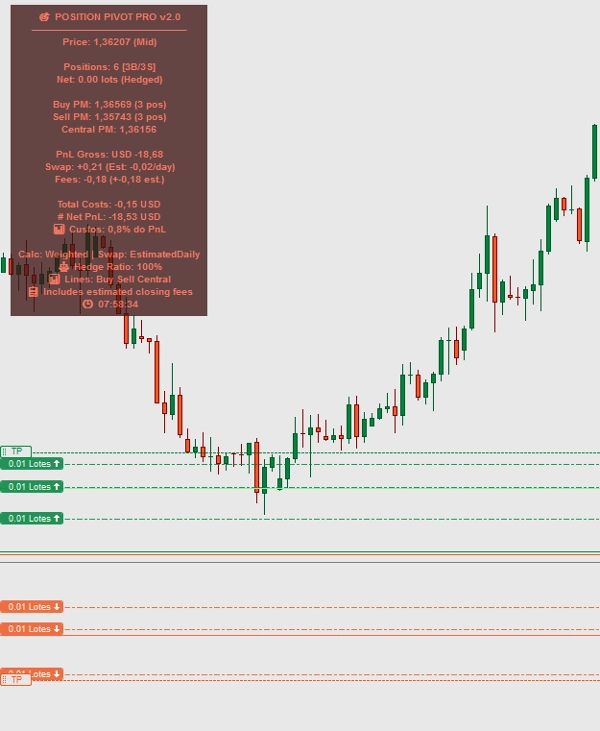
- Zeigt den berechneten Pivot-Punkt an
- Zeigt die Bewegungskraft in Pips (Abstand zum aktuellen Preis)
- Gesamtpositionen und Volumen in Lots
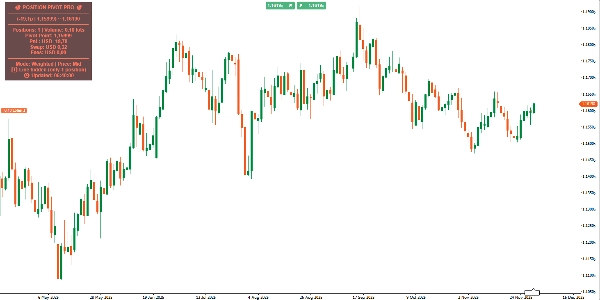
- Nicht realisierte Gewinne/Verluste, angesammelte Swaps und Gesamtkosten
- Kostenwarnsystem:
-
- Visuelle Warnungen, wenn Kommissionen oder Swaps konfigurierbare Grenzen überschreiten
- Warnungen bei hohen absoluten Kosten
- Dynamische Farben (grün/Gewinn, rot/Verlust, neutral)
- Technische Merkmale:
-
- Zero Lag: Echtzeit-Berechnungen ohne Verzögerungen
- Vollständig anpassbar: Panel-Position, Farben, Linienstärke
- Mid/Bid-Preis-Modus: Wahl der Berechnungsreferenz
- Automatische Updates bei Positionsänderungen
Vorteile für Trader:
- Schnellere Entscheidungsfindung mit konsolidierter Ansicht aller Positionen
- Verbessertes Risikomanagement durch Identifikation von Break-even-Punkten
- Kostenoptimierung durch Überwachung von Swap und Kommissionen
- Analyse der Bewegungsstärke relativ zum Pivot
Anwendungsfälle:
- Skalierung rein/raus: Ermittlung des idealen Durchschnittspreises zum Hinzufügen/Reduzieren von Positionen
- Hedge-Management: Gleichzeitige Überwachung entgegengesetzter Positionen
- Trend-Trading: Verfolgung der Entwicklung schrittweiser Einstiege
- Day-Trading: Präzise Kontrolle mehrerer Intraday-Trades
Perfekt für Trader, die Pyramiding-, Martingale- oder Multiple-Entry-Strategien verwenden und komplexe Daten direkt im Chart in umsetzbare Informationen verwandeln.
Zusammenfassung
Indikatorprofil
Kundenbewertungen
0.0
Bewertungen: 0
Kundenbewertungen
Bisher gibt es keine Bewertungen für dieses Produkt. Haben Sie es schon ausprobiert? Dann können Sie die erste Person sein, die andere darüber informiert!
Diskussion
Häufig gestellte Fragen (FAQ)
BTCUSD
Forex
Indices
EURUSD
Commodities
GBPUSD
NZDUSD
Crypto
Stocks
XAUUSD
NAS100
USDJPY
Über den cTrader Store verfügbare Produkte, einschließlich Handelsbots, Indikatoren und Plugins, werden von externen Entwicklern bereitgestellt und nur zu Informations- und technischen Zugriffszwecken verfügbar gemacht. cTrader Store ist kein Broker und erbringt keine Anlageberatung, persönlichen Empfehlungen oder eine Garantie für zukünftige Performance.
Mehr von diesem Autor


Preis
Seit 28/12/2024
54
Kostenlose Installationen