Descrizione
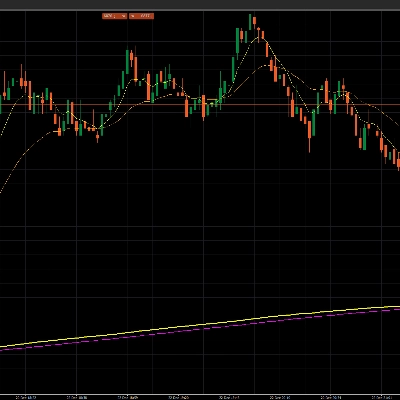
✅ VWAP (EMA) + Linea Media MVWAP — tracciata direttamente sul grafico principale
✅ Motore di Incrocio Doppio EMA (EMA1 + EMA2) — conferma chiara di trend + momentum
✅ Segnali Istantanei Long/Short sul grafico — etichette/frecce stampate esattamente allo spostamento
✅ Candele Colorate (Verde/Rosso) — visibilità immediata del bias + regime, zero esitazioni
✅ Reset VWAP della Sessione Giornaliera — ogni giorno inizia con una baseline istituzionale pulita
✅ Offset Segnale Regolabile + Dimensione del Testo — perfettamente leggibile su qualsiasi timeframe
✅ Design Pulito dell’Overlay — nessun ingombro in sottogriglia, tutto dove si prendono le decisioni
VWAP / MVWAP / Incrocio EMA — Overlay V2 è un’arma grafica veloce e senza fronzoli costruita per un solo scopo: rendere il tuo bias e gli ingressi evidenti in tempo reale.
Posiziona i livelli decisionali più importanti direttamente sul prezzo — non nascosti in pannelli — così i tuoi occhi non lasciano mai l’azione.
Il Vantaggio Fondamentale: Media vs Momentum
Questo indicatore combina due forze potenti:
- VWAP/MVWAP = dove il prezzo “dovrebbe” essere (la media / area equa)
- Incroci EMA = quando il momentum si impegna (lo spostamento / conferma)
Quando entrambi si allineano, non stai indovinando — stai negoziando una condizione strutturata.
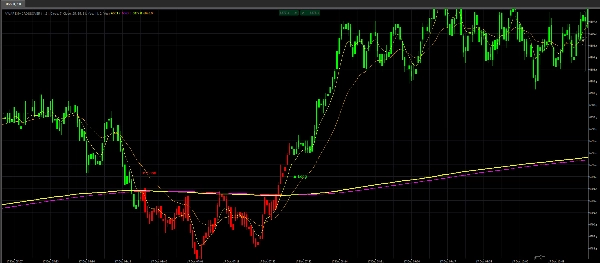
Candele Colorate: La funzione “Niente più Confusione”
La colorazione delle candele non è cosmetica — è il tuo filtro di regime in tempo reale.
- Candele verdi = condizione rialzista attiva
- Candele rosse = condizione ribassista attiva
Questo trasforma il tuo grafico in un sistema a semaforo: sai immediatamente se premere i long, restare paziente o smettere di forzare le operazioni.
Per lo scalping e decisioni rapide, questo cambia le regole del gioco: meno pensiero, più esecuzione.
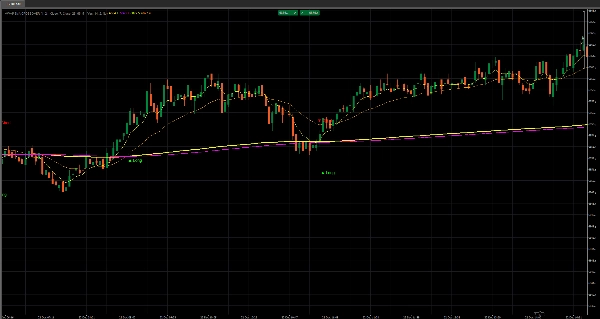
Segnali sul Grafico: Puliti, Tempificati, Azionabili
Ricevi marcatori Long / Short stampati sul grafico nel momento in cui la condizione cambia.
Questo significa:
- catturi lo spostamento in anticipo,
- eviti ingressi tardivi,
- smetti di dubitare di cosa il grafico “stia cercando di dire.”
I segnali sono posizionati con un offset regolabile e dimensioni leggibili, così rimangono puliti anche su grafici affollati.
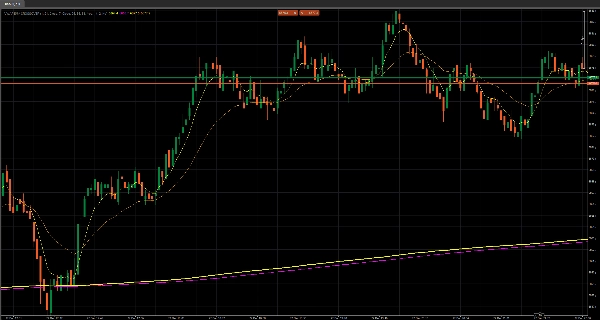
Reset VWAP della Sessione: Una Baseline Fresca Ogni Giorno
La logica VWAP si resetta quotidianamente, fornendoti una baseline di sessione coerente.
Questo significa che leggi sempre il prezzo rispetto a un ancora attuale e significativa — non una media obsoleta.
Perché i trader tengono questo sul loro grafico
Perché offre tre cose di cui ogni grafico ha bisogno:
- Bias (candele colorate + linea media)
- Conferma (incrocio doppio EMA)
- Tempismo (trigger Long/Short istantanei sul prezzo)
Se vuoi un overlay pulito che trasformi candele casuali in un sistema leggibile — questa è la tua layer di esecuzione plug-and-play.


