Descrizione
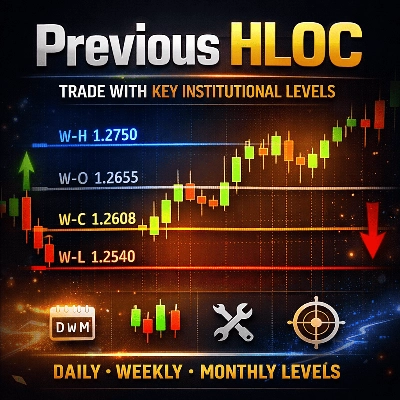
Previous HLOC – Livelli Smart a Timeframe Superiore per un Trading di Precisione
Previous HLOC è un indicatore professionale multi-timeframe che traccia i livelli di High, Low, Open e Close del periodo precedente direttamente sul tuo grafico con chiarezza e personalizzazione senza pari.
Progettato per trader price-action, scalper, trader intraday e swing trader, questo indicatore ti aiuta a identificare istantaneamente livelli istituzionali chiave che spesso fungono da supporto, resistenza, zone di rifiuto e obiettivi di liquidità.
Perché Previous HLOC?
I mercati reagiscono costantemente ai livelli del giorno, della settimana e del mese precedente. Istituzioni, algoritmi e trader professionisti monitorano attentamente questi livelli.
Previous HLOC porta quei prezzi critici sul tuo grafico in modo pulito e senza distrazioni—così non li perdi mai.
Caratteristiche Chiave
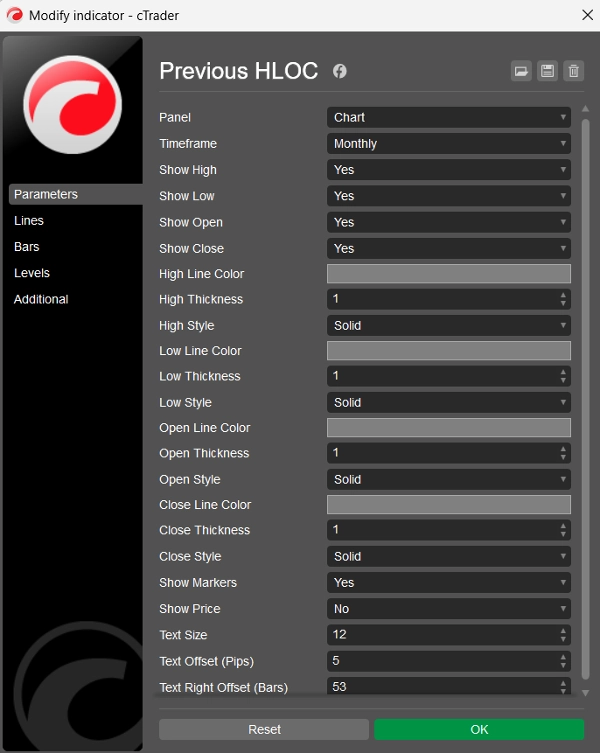
✅ Livelli Multi-Timeframe
- Scegli livelli della candela precedente Giornalieri, Settimanali, Mensili o Orari
- I livelli rimangono accurati indipendentemente dal timeframe del tuo grafico
✅ Controllo Completo di HLOC
- Abilita o disabilita High, Low, Open, Close singolarmente
- Fai trading solo su ciò che conta per la tua strategia
✅ Personalizzazione Avanzata
- Colore, spessore e stile della linea separati per ogni livello
- Marcatori puliti in font Consolas con dimensione del testo regolabile
- Visualizzazione opzionale del prezzo accanto a ogni marcatore
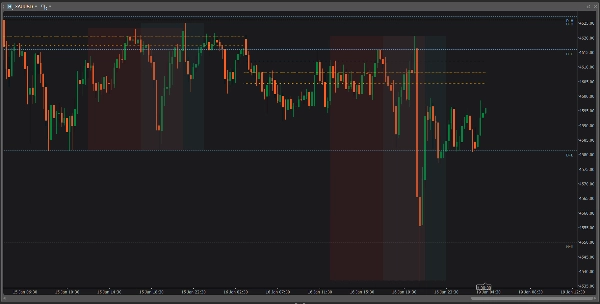
✅ Marcatori Fluttuanti Intelligenti
- I marcatori si muovono naturalmente con il grafico
- Rimangono sempre allineati con il livello di prezzo durante lo scorrimento
- Posizionati sul lato destro per una chiara visibilità
✅ Livelli Proiettati nel Futuro
- Le linee si estendono molto nel futuro
- Ideale per pianificare ingressi, uscite, stop-loss e livelli di take-profit
🔹 Come Lo Usano i Trader
📌 Identifica forti supporti e resistenze intraday
📌 Usa High/Low precedenti come zone di sweep di liquidità
📌 Fai trading su breakout, rifiuti e retest
📌 Allinea gli ingressi con il bias a timeframe superiore
📌 Migliora la precisione rischio-rendimento
🔹 Per Chi È Questo Indicatore?
✔ Trader Forex
✔ Trader di indici e commodity
✔ Scalper e day trader
✔ Swing trader
✔ Trader price-action e SMC
🔹 Pulito. Veloce. Affidabile.
- Nessun repaint
- Nessun ritardo
- Nessun ingombro
- Funziona su tutti i simboli e tutti i timeframe
🔹 Sintesi
Previous HLOC non è solo un altro indicatore di livelli—è uno strumento professionale di trading che ti aiuta a fare trading con contesto, struttura e fiducia.
Se fai trading intorno ai livelli della sessione precedente, questo indicatore deve essere sul tuo grafico.
Riepilogo
Recensioni dei clienti
5 | 100 % | |
4 | 0 % | |
3 | 0 % | |
2 | 0 % | |
1 | 0 % |


