
Tracking Performance by Quantara
Indicatore
31 download
Versione 1.0, Feb 2026
Windows, Mac
Descrizione
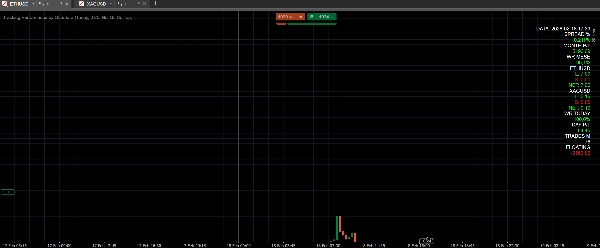
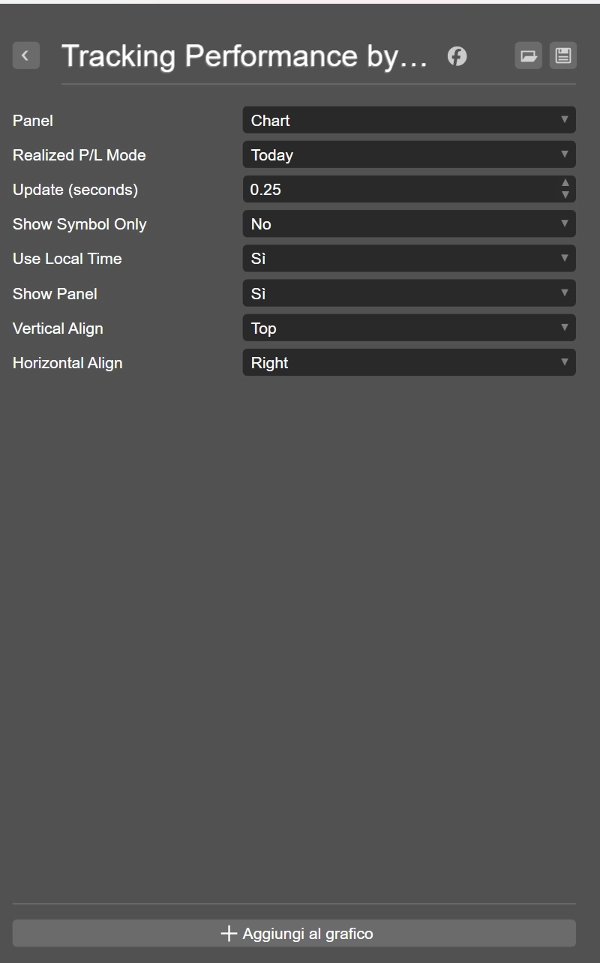
Tracking Perfromance by Quantara è un indicatore da cruscotto che mostra metriche di performance in tempo reale e l'esposizione per singolo asset.
Mostra: P/L mensile e giornaliero, tasso di vincita mensile e giornaliero, conteggio mensile delle operazioni, P/L flottante, spread in percentuale e long/short/net per ogni asset aperto.
Tutti i valori sono codificati a colori per una lettura rapida (P/L positivo/negativo, soglie del tasso di vincita, long verde, short rosso).
Cosa calcola/mostra
- Spread % (con soglie diverse per metalli e criptovalute)
- P/L mensile e giornaliero
- Tasso di vincita mensile e giornaliero
- Conteggio mensile delle operazioni
- P/L flottante
- Esposizione per asset (long / short / net)
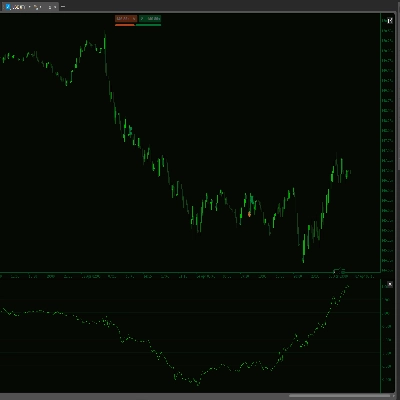
Strumenti/tempi consigliati
- Funziona su qualsiasi strumento e qualsiasi timeframe
- Suggerito sui grafici principali (M15–H4) per il monitoraggio giornaliero
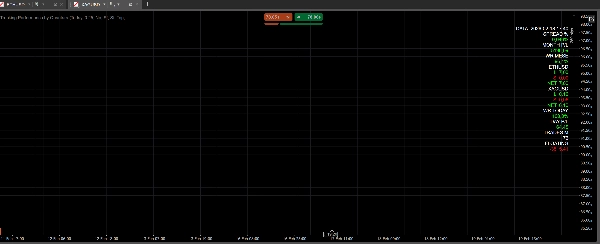
Come usare
- Aggiungi l'indicatore a un grafico
- Imposta l'intervallo di aggiornamento (Update seconds)
- Usa Show Panel per attivare/disattivare la visibilità
- Usa “Show Symbol Only” per filtrare solo il simbolo del grafico
- Usa “Use Local Time” per applicare filtri basati sull'ora locale
Parametri chiave
- Update (seconds): frequenza di aggiornamento
- Show Symbol Only: mostra solo il simbolo del grafico
- Use Local Time: usa l'ora locale per i filtri
- Show Panel: mostra/nascondi il pannello
- Vertical/Horizontal Align: posizionamento del pannello
Casi d'uso
- Controllo rapido dell'esposizione netta per asset
- Monitoraggio delle performance giornaliere e mensili
- Monitoraggio del tasso di vincita per la qualità operativa
- Monitoraggio dello spread % per metalli e criptovalute
Disclaimer
Il trading comporta rischi. Le performance passate non garantiscono risultati futuri.
Riepilogo
Riepilogo AI
Tracking Performance by Quantara is a dashboard indicator designed for real-time monitoring of trading performance across multiple assets. It provides key metrics including monthly and daily profit and loss (P/L), win rate, trade count, floating P/L, and spread percentage, with specific thresholds for metals and cryptocurrencies. The indicator also displays per-asset exposure categorized as long, short, or net positions. All values are dynamically color-coded to facilitate quick interpretation, highlighting positive/negative P/L, win-rate levels, and position types.
This tool is compatible with any trading instrument and timeframe, with a recommendation for use on main charts ranging from 15-minute to 4-hour intervals for daily performance tracking. Users can customize update frequency, toggle panel visibility, filter data to the current chart symbol, and apply local time settings. The indicator supports quick assessment of net exposure, daily and monthly performance, win-rate monitoring, and spread percentage analysis for metals and crypto markets.
Key parameters include update interval, symbol filtering, local time usage, panel display options, and panel alignment. This indicator is applicable across Forex, Indices, Commodities, Crypto, and Stocks markets.
Profilo indicatore
Recensioni dei clienti
0.0
Recensioni: 0
Recensioni dei clienti
Questo prodotto non ha ancora ricevuto recensioni. L'hai già provato? Fallo sapere agli altri per primo!
Discussioni
Domande frequenti
Forex
Indices
Commodities
Crypto
Stocks
I prodotti disponibili tramite cTrader Store, inclusi bot di trading, indicatori e plugin, sono forniti da sviluppatori terzi e resi disponibili esclusivamente a scopo informativo e di accesso tecnico. cTrader Store non è un broker e non fornisce consulenze in materia di investimento, raccomandazioni individualizzate o garanzie di risultati futuri.


Prezzo
Da 29/01/2026
31
Installazioni gratuite