Descrizione
Un indicatore compatto per scalping su cTrader che combina tre elementi in un'unica sovrapposizione pulita: un VWAP giornaliero basato sulla sessione, una guida all'Opening Range, bolle “delta/potenza” come indicatori di momentum/attività e zone dinamiche di domanda/offerta con stato di test/conferma più un filtro di tendenza opzionale. Inoltre, include un semaforo multi-timeframe che mostra, a colpo d'occhio, la direzione della candela più recentemente chiusa su diversi timeframe (VWAP + Opening Range).
Nota: I parametri sono progettati intenzionalmente per permetterti di adattare rapidamente lo strumento al tuo mercato/timeframe; la logica funziona automaticamente in background.
Cosa ottieni (funzionalità)
- VWAP giornaliero (si resetta ogni giorno di trading): visualizza il “prezzo di sessione” equo e aiuta con la reversione alla media, i pullback e il bias direzionale
- High/low dell'Opening Range (OR): disegna l'opening range per strutturare setup di breakout/reversal (minuti definiti automaticamente o manualmente)
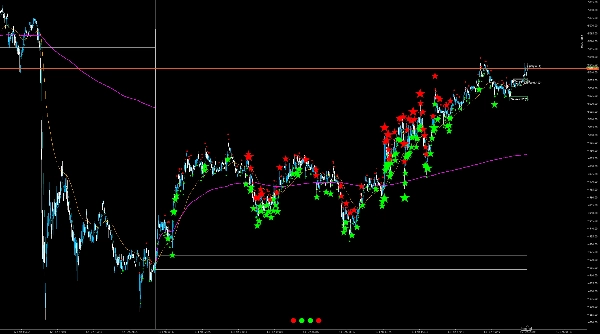
- Bollicine Delta/Potenza: evidenziano le candele con attività superiore alla media (a seconda della modalità: picco di volume, volume corpo/intervallo, o proxy delta) e le colorano in base alla direzione (rialzista/ribassista)
- Zone di domanda/offerta (due set di pivot A/B): zone automatiche da pivot confermati alti/bassi, con profondità della zona basata su ATR, un'estensione definita a destra e una linea mediana opzionale
- Stato della zona: “Fresca → Testata → Confermata” (conferma opzionalmente tramite una condizione di volume) così puoi vedere immediatamente se una zona è già stata testata e se ha reagito con forza
- Filtro di tendenza (opzionale): filtro EMA o EMA+ADX così le zone sono mostrate/considerate solo nella direzione della tendenza (es. zone di domanda solo in un trend rialzista)
- Semaforo multi-TF: mostra M1/M5/H1/D1 come verde/rosso/grigio a seconda dell'ultima candela chiusa—contesto utile senza cambiare timeframe del grafico
Cosa possono configurare gli acquirenti (panoramica dei parametri)
Le impostazioni sono raggruppate e volutamente pratiche:
Nucleo
- Lunghezza ATR: input base per la profondità della zona e alcune metriche delle bolle
- Mostra VWAP giornaliero: On/Off
- Mostra Opening Range: On/Off
- Modalità OR: Auto (dipende dal TF del grafico) o Manuale (minuti fissi)
- Fattore auto OR / minuti OR: regola finemente la durata dell'OR
Filtro di Tendenza
- Modalità: Off / EMA / EMA+ADX
- EMA veloce / EMA lenta: direzione della tendenza tramite incrocio/relazione EMA
- Lunghezza ADX + soglia: forza minima della tendenza quando EMA+ADX è abilitato
- Traccia linee EMA: opzionalmente mostra le EMA filtro sul grafico
Bollicine
- Mostra bolle: On/Off
- Proxy delta: tre varianti (ponderato per intervallo, close vs prev, close vs open) a seconda dello strumento/feed
- Metrica bolla: Auto o metrica fissa (delta assoluto, picco di volume, volume corpo/intervallo)
- Lookback quantile + % quantile: controlla quanto è “raro” un segnale di bolla (percentuale più alta = solo eventi più forti)
- Limite etichetta: quante etichette di bolle rimangono sul grafico (prestazioni/chiarezza)
- Font base + modalità 4K: scala visiva per display ad alta risoluzione
- Glifo piccolo/grande: forma della bolla (punto/cerchio, ecc.)
- Debug: forza bolle (solo test)
Zone
- Mostra zone: On/Off
- Profondità zona × ATR: spessore della zona (adattivo alla volatilità)
- Estendi (barre): quanto le zone si estendono a destra
- Mostra linea mediana: On/Off
- Solo zone in trend: mostra le zone solo quando la direzione del filtro di tendenza corrisponde
- Parametri pivot A & B (sinistra/destra): due sensibilità (es. zone “grossolane” + “fini”)
- Dimensione etichetta zona: Piccola/Media/Grande
- Colori (ARGB): colori separati per domanda/offerta, testata, confermata + linea mediana
- Conferma tramite volume + vol-MA/moltiplicatore: conferma solo se il volume tick è sopra MA × fattore
Semaforo
- Mostra semaforo: On/Off
- Font + scala 4K: dimensione/leggibilità
- Aggiorna ogni N barre: frequenza di aggiornamento (prestazioni vs reattività)
(Le descrizioni dei campi parametri possono essere presentate chiaramente tramite l'attributo/descrizioni Parameter; la piattaforma supporta raggruppamenti e descrizioni direttamente nell'interfaccia utente dei parametri.)
A chi è rivolto
- Scalper e trader intraday che necessitano di un contesto rapido: VWAP/OR per la struttura, bolle per “attività”, zone per aree di reazione
- Trader che vogliono una visualizzazione chiara senza sovrapporre più indicatori
- Utenti che potrebbero voler una vista opzionale filtrata per tendenza (EMA/ADX), mantenendo il nucleo come display plug-and-play
Uso tipico (breve e pratico)
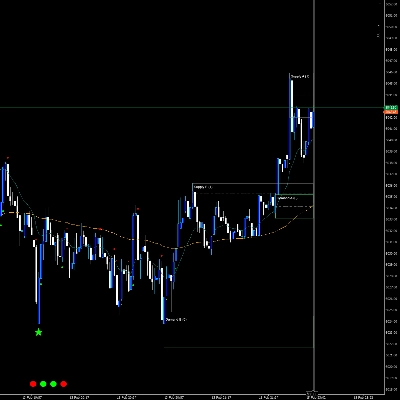
Controlla il bias tramite VWAP + semaforo, e usa l'OR come “zona di battaglia” durante la fase di apertura.
Usa le bolle come indizio che “qui sta succedendo qualcosa sopra la media” (breakout, assorbimento, impulso).
Usa le zone come aree di pianificazione: primo tocco = “Testata”; una reazione con alto volume può essere marcata come “Confermata”; la linea mediana aiuta con un trading pulito da livello a livello.


![Logo di "Wyckoff Toolkit [Iridio Capital]"](https://cdn.ctrader.com/image/webp/8acfe6a1-6a8e-4578-9367-9df3af2b1801_27763)


