Descrizione
🚀 Trasforma il tuo grafico in un centro decisionale strategico
Smart Tech Analysis non è solo un indicatore.
È un cruscotto di analisi intelligente completo, sviluppato per i trader che vogliono chiarezza, precisione e agilità nel processo decisionale.
Mentre la maggior parte degli indicatori fornisce solo informazioni isolate, Smart Tech Analysis integra:
✔ Trend
✔ Volume
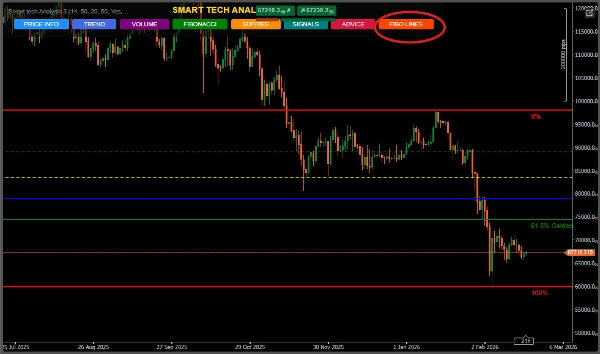
✔ Fibonacci
✔ Supporto e Resistenza
✔ Segnali Tecnici
✔ Raccomandazioni Operative
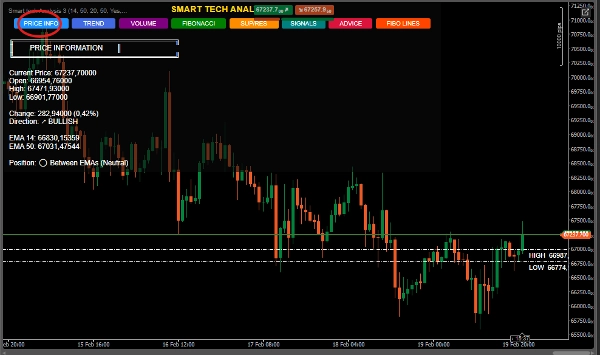
✔ Informazioni dettagliate sul prezzo
Tutto in un unico cruscotto dinamico e interattivo.
🔥 LA GRANDE DIFFERENZA
🎯 1. Sistema 6-in-1 – Analisi Integrata
Non è più necessario passare da un indicatore all'altro.
Smart Tech Analysis combina:
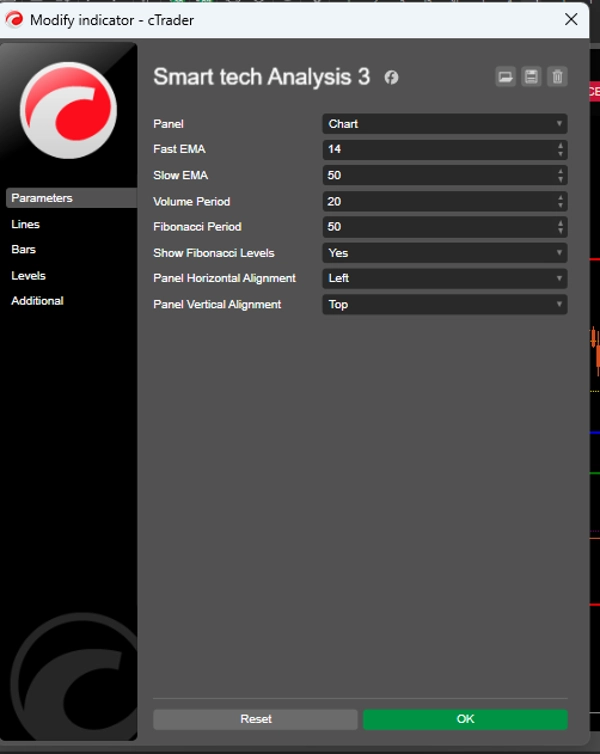
📈 EMA veloci e lente (14 e 50)
📊 Volume con analisi comparativa
🧩 Fibonacci automatico
🛡 Supporto e resistenza dinamici
🚦 Generazione intelligente di segnali
📌 Raccomandazioni con stop e target calcolati
👉 Questo riduce il rumore visivo e aumenta l'oggettività.
🧠 2. Pannello Interattivo Esclusivo
Interfaccia professionale con pulsanti intelligenti:
INFO PREZZO
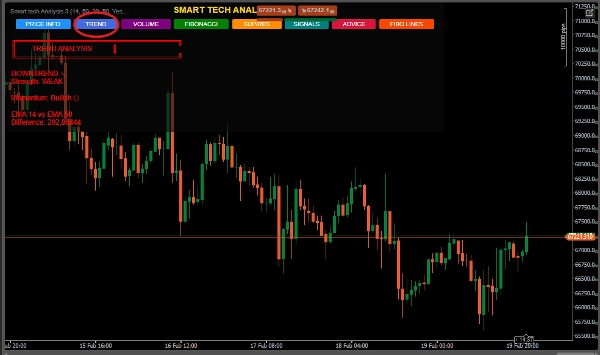
TREND
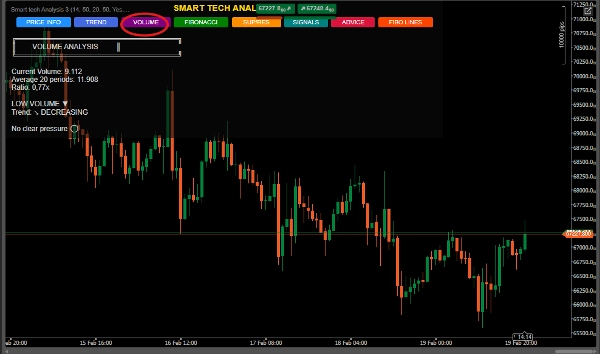
VOLUME
FIBONACCI
SUP/RES
SEGNALI
CONSIGLI
Il trader sceglie esattamente cosa vuole vedere.
📌 Organizzazione.
📌 Controllo.
📌 Professionalità.
📈 3. Analisi del Trend con Forza e Slancio
Non mostra solo se sta salendo o scendendo.
Calcola:
Intensità del trend
Forza percentuale tra le EMA
Classificazione: Debole, Moderato o Forte
Questo evita ingressi deboli in mercati laterali.
📊 4. Volume con Lettura Istituzionale
Il sistema identifica:
Volume estremo
Pressione di acquisto o vendita
Accelerazione o decelerazione
Confronto con la media storica
👉 Ideale per rilevare possibili attività istituzionali.
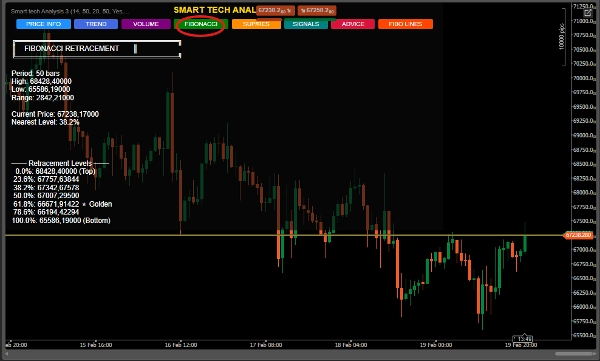
🧩 5. Fibonacci Automatico con Zona Dorata
Calcolato dinamicamente sul periodo definito.
Evidenzia speciale per:
⭐ Zona 61,8% (Zona Dorata)
📌 Identificazione del livello più vicino
📌 Estensioni rialziste e ribassiste
📌 Raccomandazione contestuale automatica
Perfetto per trader di ritracciamento e swing trader.
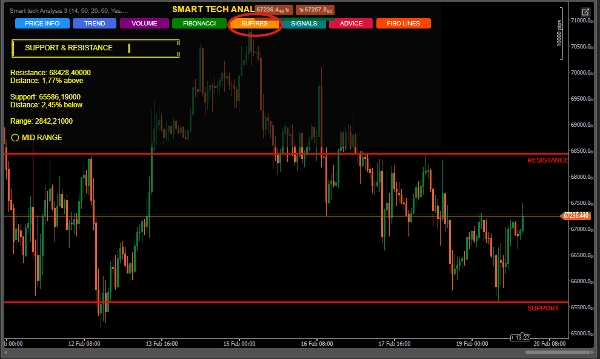
🛡 6. Supporto e Resistenza Intelligenti
Rileva massimi e minimi rilevanti
Mostra la distanza percentuale dal prezzo attuale
Classifica la posizione: Vicino al supporto, resistenza o a metà intervallo
Disegna linee automatiche sul grafico
Ideale per entrare in zone strategiche.
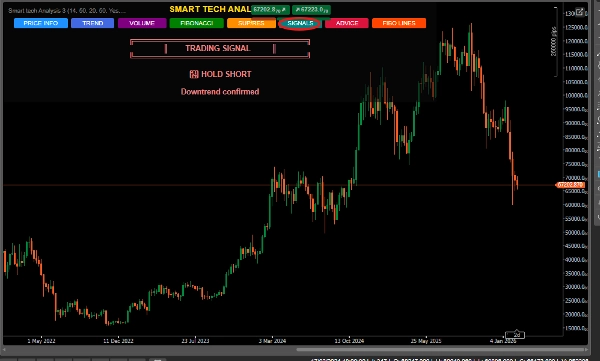
🚦 7. Sistema di Segnali di Confluenza
L'algoritmo non genera segnali casuali.
Combina:
✔ Incrocio EMA
✔ Prossimità a supporto/resistenza
✔ Struttura del trend
✔ Contesto del prezzo
Classificazione:
🟢 ACQUISTO FORTE
🔴 VENDITA FORTE
📈 MANTIENI LONG
📉 MANTIENI SHORT
⏸ ASPETTA
Con livello di fiducia indicato.
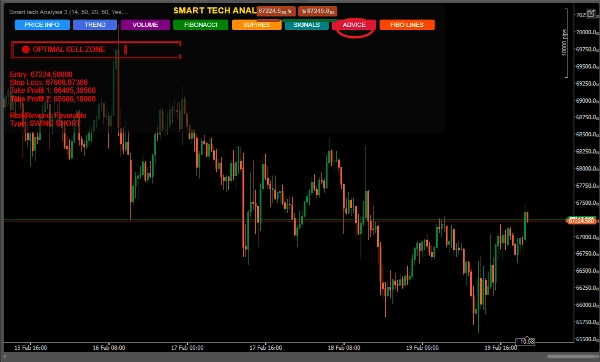
🎯 8. Raccomandazioni con Gestione del Rischio
Il pannello "CONSIGLI" fornisce:
Ingresso suggerito
Stop Loss tecnico
Due obiettivi di Take Profit
Struttura dello swing (Long o Short)
Contesto dell'operazione
👉 Non è solo analisi.
👉 È un piano strutturato.
🏆 Per chi è questo indicatore?
✔ Trader principianti che necessitano di chiarezza
✔ Trader intermedi che vogliono confluenza
✔ Trader avanzati alla ricerca di efficienza
✔ Swing trader
✔ Scalper che utilizzano conferme strutturali
💎 Perché si distingue nel mercato? Indicatori comuni Smart Tech Analysis
Informazioni isolate Analisi integrata Inquinamento visivo Cruscotto organizzato Nessun contesto Confluenza tecnica Nessuna gestione Stop e target suggeriti Segnali semplici Segnali con conferma
📊 Benefici diretti
✔ Riduce le decisioni emotive
✔ Aumenta la precisione
✔ Migliora la lettura strutturale
✔ Fa risparmiare tempo
✔ Eleva lo standard professionale del trader
🧠 Posizionamento sul mercato
Smart Tech Analysis è ideale per:
Mercato Forex
Indici
Materie prime
Criptovalute


