Beschreibung
SC RSI Dots
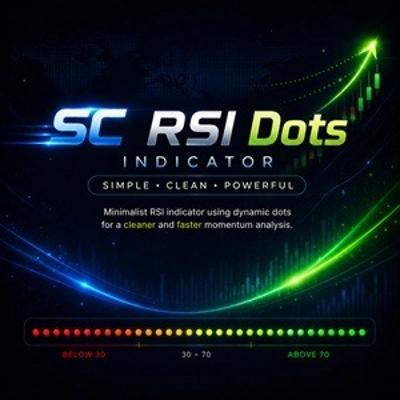
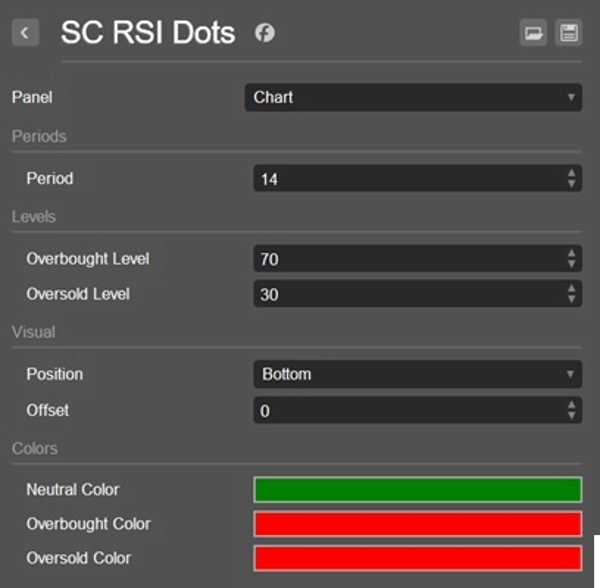
Minimalistischer RSI-Indikator mit dynamischen Punkten für eine klarere und schnellere Visualisierung des Momentums.
SC RSI Dots ist eine minimalistische Interpretation des klassischen RSI (Relative Strength Index), entwickelt, um eine klarere und intuitivere Ansicht des Marktmomentums zu bieten, ohne das Chart mit unnötigen Linien zu überladen.
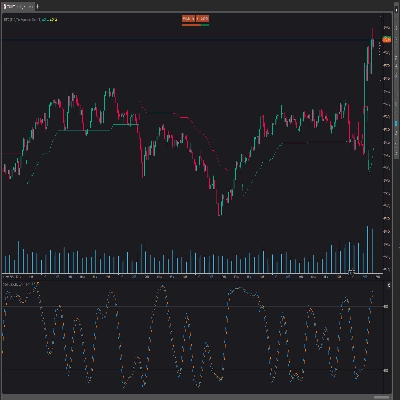
Anstatt die traditionelle RSI-Linie anzuzeigen, verwendet der Indikator dynamische Punkte, um die RSI-Werte im Zeitverlauf darzustellen.
Dieser Ansatz schafft ein saubereres, moderneres Chart-Layout, das leichter zu lesen ist, insbesondere für Trader, die mehrere Werkzeuge gleichzeitig verwenden.
Hauptmerkmale
- RSI wird mit Punkten statt Linien dargestellt
- Saubereres und weniger ablenkendes Chart-Design
- Dynamische Farbvisualisierung basierend auf der RSI-Position
- Spezielle Farbe für überverkaufte Bedingungen
- Spezielle Farbe für überkaufte Bedingungen
- Progressive Farbintensität, wenn der RSI extreme Werte erreicht
- Sofortige visuelle Erkennung von Momentumwechseln
- Schnelle Erkennung von Marktstärke und -schwäche
- Ideal für Scalping, Intraday-Handel und diskretionären Handel
Wie das Farbsystem funktioniert
SC RSI Dots verwendet eine dynamische Farb-Engine, um die RSI-Interpretation zu vereinfachen.
- Eine spezielle Farbe kennzeichnet überverkaufte Bedingungen.
- Eine spezielle Farbe kennzeichnet überkaufte Bedingungen.
- Zwischen diesen beiden Zonen nimmt die Farbintensität allmählich zu, wenn der RSI sich einem der Extreme nähert.
Dieser visuelle Ansatz ermöglicht es Tradern, sofort zu erkennen, wo sich das Momentum entwickelt, ohne ständig eine traditionelle Oszillatorlinie überwachen zu müssen.
Das Ergebnis ist eine schnellere und intuitivere Ablesung der RSI-Bedingungen direkt aus dem Chart.
Warum SC RSI Dots verwenden
Traditionelle RSI-Indikatoren erfordern oft, dass Trader die Oszillatorlinie und deren Interaktion mit überkauften und überverkauften Niveaus ständig überwachen.
SC RSI Dots wurde mit einem Ziel entwickelt:
das Chart visuell sauber zu halten und dennoch alle wesentlichen Informationen über Momentum und Marktbedingungen bereitzustellen.
Die adaptive Punktvisualisierung erleichtert die Erkennung von:
- Zunehmendem bullischem Momentum
- Zunehmendem bärischem Momentum
- Annäherung an überkaufte Bedingungen
- Annäherung an überverkaufte Bedingungen
- Mögliche Erschöpfung des Momentums
Das alles ohne die Ablenkung durch zusätzliche Linien auf dem Bildschirm.
Perfekt für
- Trader, die saubere Charts bevorzugen
- Momentum-Trader
- Price-Action-Trader
- Scalper und Daytrader
- Multi-Indikator-Handelssetups
- Schnelle Marktanalyse
Wichtiger Hinweis
SC RSI Dots ist dafür konzipiert, direkt auf dem Hauptpreischart verwendet zu werden.
Im Gegensatz zu traditionellen RSI-Indikatoren basiert sein visuelles Konzept darauf, Momentum-Informationen in die Preisaktionsanalyse zu integrieren. Aus diesem Grund wird die Verwendung des Indikators in einem separaten Panel nicht empfohlen und bietet nicht die beabsichtigte Benutzererfahrung.
Einfach. Sauber. Intuitiv.
Zusammenfassung
Key features include:
- RSI values represented by dots with dynamic colors reflecting momentum strength.
- Distinct colors for oversold and overbought conditions.
- Progressive color intensity indicating proximity to extreme RSI levels.
- Instant visual cues for momentum shifts, market strength, and weakness.
The indicator is suitable for scalping, intraday, momentum, and price action traders who prefer clean charts and use multiple tools simultaneously. It supports visualization of reversal signals, trend strength, and level touches or breaks based on RSI behavior. SC RSI Dots is intended for use on the main price chart rather than a separate panel, enhancing direct correlation between momentum and price movements.
Diskussion
Kundenbewertungen
5 | 100 % | |
4 | 0 % | |
3 | 0 % | |
2 | 0 % | |
1 | 0 % |





![„Session Volume Profile (SVP) [Iridio Capital]“-Logo](https://cdn.ctrader.com/image/webp/b058beb7-b143-45f3-87d0-8c524c00b203_61552)