
Descrizione
Livelli Numeri Tondi - Indicatore per cTrader
Descrizione
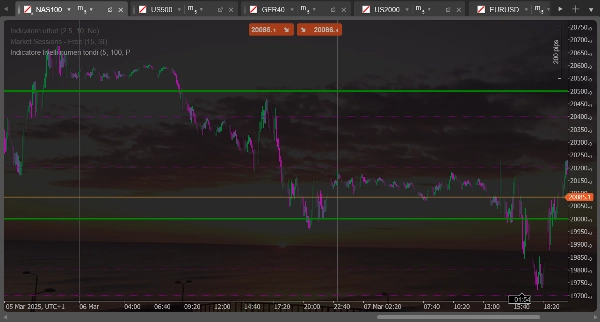
Questo indicatore disegna linee orizzontali a "numeri tondi" o livelli psicologicamente significativi sul grafico. È ideale per identificare potenziali aree di supporto e resistenza basate su livelli di prezzo rotondi che spesso hanno importanza psicologica per i trader.
Funzioni principali
- Disegna due set distinti di linee orizzontali a intervalli regolari
- Calcola automaticamente i livelli in base al prezzo di chiusura corrente
- Si aggiorna dinamicamente quando il prezzo si muove
- Offre configurazione separata per ogni set di linee (colore, stile, dimensione)
Regolazioni possibili
Per il primo set di linee (tratteggiato)
- Numero di Linee Set 1: Determina quante linee disegnare sopra e sotto il prezzo attuale (default: 5)
- Dimensione Range Set 1: Imposta la distanza tra le linee in pip (default: 100 pip)
- Colore Linee Set 1: Personalizza il colore delle linee (default: viola)
- Spessore Linee Set 1: Imposta lo spessore delle linee (default: 1 pixel)
Per il secondo set di linee (continuo)
- Numero di Linee Set 2: Determina quante linee disegnare sopra e sotto il prezzo attuale (default: 2)
- Dimensione Range Set 2: Imposta la distanza tra le linee in pip (default: 500 pip)
- Colore Linee Set 2: Personalizza il colore delle linee (default: verde)
- Spessore Linee Set 2: Imposta lo spessore delle linee (default: 1 pixel)
Utilizzo pratico
Tipicamente, il primo set (linee tratteggiate) viene utilizzato per identificare livelli psicologici minori, mentre il secondo set (linee continue) evidenzia livelli psicologici maggiori. Ad esempio, per EURUSD potresti impostare il primo set per mostrare livelli ogni 100 pip (come 1.0800, 1.0900) e il secondo set per livelli ogni 500 pip (come 1.0500, 1.1000).
Questi livelli spesso coincidono con zone di supporto o resistenza dove il prezzo potrebbe rimbalzare o rallentare prima di continuare il suo movimento.
Livelli Numeri Tondi - Indicatore per cTrader
Descrizione
Questo indicatore disegna linee orizzontali a "numeri tondi" o livelli psicologicamente significativi sul grafico. È ideale per identificare potenziali aree di supporto e resistenza basate su livelli di prezzo rotondi che spesso hanno importanza psicologica per i trader.
Funzioni principali
- Disegna due set distinti di linee orizzontali a intervalli regolari
- Calcola automaticamente i livelli in base al prezzo di chiusura corrente
- Si aggiorna dinamicamente quando il prezzo si muove
- Offre configurazione separata per ogni set di linee (colore, stile, dimensione)
Regolazioni possibili
Per il primo set di linee (tratteggiato)
- Numero di Linee Set 1: Determina quante linee disegnare sopra e sotto il prezzo attuale (default: 5)
- Dimensione Range Set 1: Imposta la distanza tra le linee in pip (default: 100 pip)
- Colore Linee Set 1: Personalizza il colore delle linee (default: viola)
- Spessore Linee Set 1: Imposta lo spessore delle linee (default: 1 pixel)
Per il secondo set di linee (continuo)
- Numero di Linee Set 2: Determina quante linee disegnare sopra e sotto il prezzo attuale (default: 2)
- Dimensione Range Set 2: Imposta la distanza tra le linee in pip (default: 500 pip)
- Colore Linee Set 2: Personalizza il colore delle linee (default: verde)
- Spessore Linee Set 2: Imposta lo spessore delle linee (default: 1 pixel)
Utilizzo pratico
Tipicamente, il primo set (linee tratteggiate) viene utilizzato per identificare livelli psicologici minori, mentre il secondo set (linee continue) evidenzia livelli psicologici maggiori. Ad esempio, per EURUSD potresti impostare il primo set per mostrare livelli ogni 100 pip (come 1.0800, 1.0900) e il secondo set per livelli ogni 500 pip (come 1.0500, 1.1000).
Questi livelli spesso coincidono con zone di supporto o resistenza dove il prezzo potrebbe rimbalzare o rallentare prima di continuare il suo movimento.
Riepilogo
Recensioni dei clienti
5 | 50 % | |
4 | 50 % | |
3 | 0 % | |
2 | 0 % | |
1 | 0 % |


