
DynamicVolumeSupplyDemand
Indicatore
1.29K download
Versione 1.0, Apr 2025
Windows, Mac
4.2
Recensioni: 5
Descrizione
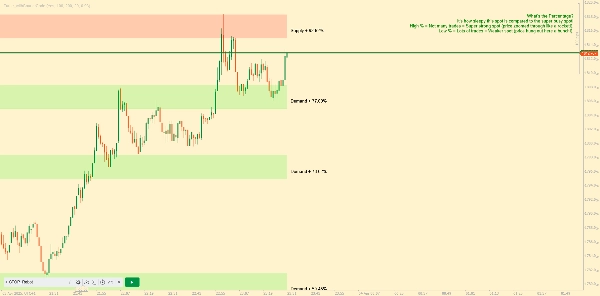
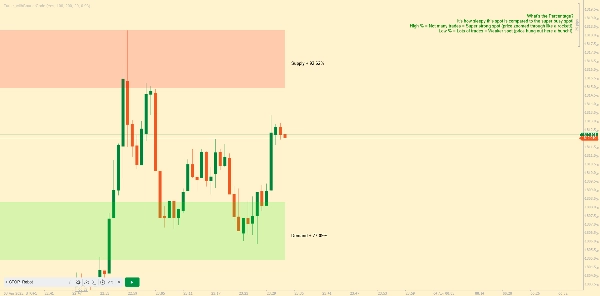
Presentazione delle Zone Dinamiche di Offerta e Domanda di AlgoAlpha ricreate da me per la piattaforma Ctrader. Questo indicatore è progettato per identificare e visualizzare automaticamente le zone dinamiche di offerta e domanda sul tuo grafico, aiutando i trader a individuare potenziali aree di inversione e a valutare il sentiment del mercato con maggiore chiarezza. Si adatta alle condizioni di mercato utilizzando un meccanismo dinamico di look-back, rendendolo più reattivo ai movimenti recenti dei prezzi. 📈💡
Caratteristiche principali
- 📊 Look-Back Dinamico: Regola automaticamente il periodo di look-back basandosi sul punto pivot più recente, assicurando che vengano analizzati i dati più rilevanti.
- 🎯 Rilevamento dei Punti Pivot: Utilizza un periodo definito dall'utente per rilevare i massimi e minimi pivot significativi, segnando con precisione i potenziali punti di inversione.
- 🛠 Parametri Personalizzabili: Offre ampie opzioni di personalizzazione tra cui il periodo di look-back, la sensibilità del rilevamento pivot, la risoluzione e la tolleranza della zona.
- 🗺 Visualizzazione Grafica: Mostra le zone di offerta e domanda come riquadri sul grafico, evidenziando lo sfondo per differenziare tra zone rialziste e ribassiste.
- 🖍 Zone Codificate a Colori: Le zone sono codificate a colori per una facile identificazione: verde per rialzista, rosso per ribassista e grigio per livelli neutrali.
Riepilogo
Riepilogo AI
DynamicVolumeSupplyDemand is an indicator for the cTrader platform that automatically identifies and visualizes dynamic supply and demand zones on trading charts. It helps traders locate potential reversal areas and evaluate market sentiment by adapting to recent price movements through a dynamic look-back mechanism. Key features include:
- Dynamic Look-Back: Automatically adjusts the look-back period based on the latest pivot points to analyze the most relevant data.
- Pivot Point Detection: Uses a user-defined period to detect significant pivot highs and lows, marking potential reversal points.
- Customizable Parameters: Allows adjustment of look-back period, pivot detection sensitivity, resolution, and zone tolerance.
- Visual Display: Presents supply and demand zones as boxes on the chart with background highlighting to distinguish bullish and bearish zones.
- Color-Coded Zones: Zones are color-coded for clarity—green for bullish, red for bearish, and gray for neutral levels.
This indicator supports enhanced clarity in market analysis by dynamically adapting to changing market conditions and providing clear visual cues for supply and demand levels.
Profilo indicatore
Recensioni dei clienti
4.2
Recensioni: 5
5 | 40 % | |
4 | 40 % | |
3 | 20 % | |
2 | 0 % | |
1 | 0 % |
Recensioni dei clienti
October 12, 2025
Could you please make a new indicator so too remove the explanation and how the indicator works written on the chart? Very nice indicator otherwise!
August 12, 2025
Pros: Identifies dynamic supply and demand zones based on volume. Flexible settings, strong visual clarity. Cons: No alerts or tooltips. Lacks history of previous zones and user template saving.
May 15, 2025
This indicator finds the supply and demand areas very well but it has a problem. But the explanation and how the indicator works written on the chart is very annoying. I hope the designer of this software will solve this problem. Thank you
Discussioni
Domande frequenti
I prodotti disponibili tramite cTrader Store, inclusi bot di trading, indicatori e plugin, sono forniti da sviluppatori terzi e resi disponibili esclusivamente a scopo informativo e di accesso tecnico. cTrader Store non è un broker e non fornisce consulenze in materia di investimento, raccomandazioni individualizzate o garanzie di risultati futuri.


Prezzo
Da 09/01/2025
11.78K
Installazioni gratuite