
Açıklama
Grafiklerinizi işaretlemek için sonsuza kadar zaman harcamaktan bıktınız mı? Bu gösterge bunu sizin için süper hızlı yapar.
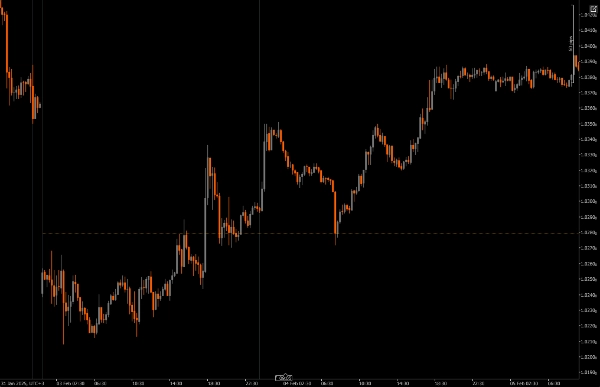
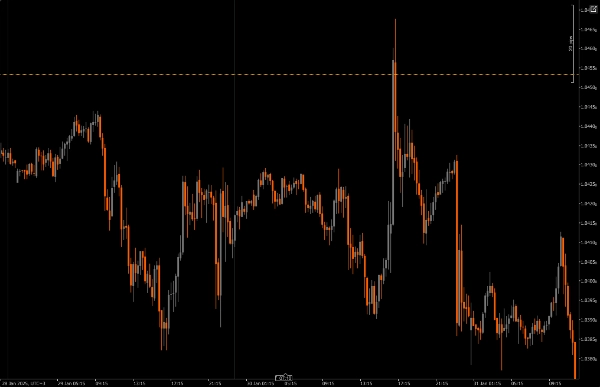
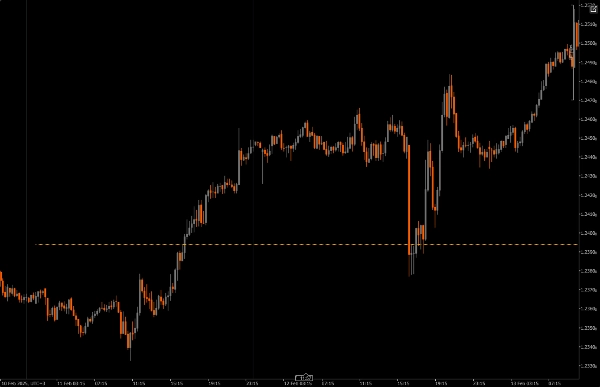
Önceki günün en yüksek ve en düşük noktası arasındaki orta noktayı bulur ve bunu grafiklerinize çizer. Artık grafiklerinizi süper hızlı tarayabilirsiniz. Çok kolay!
Bazı Harika Özellikler
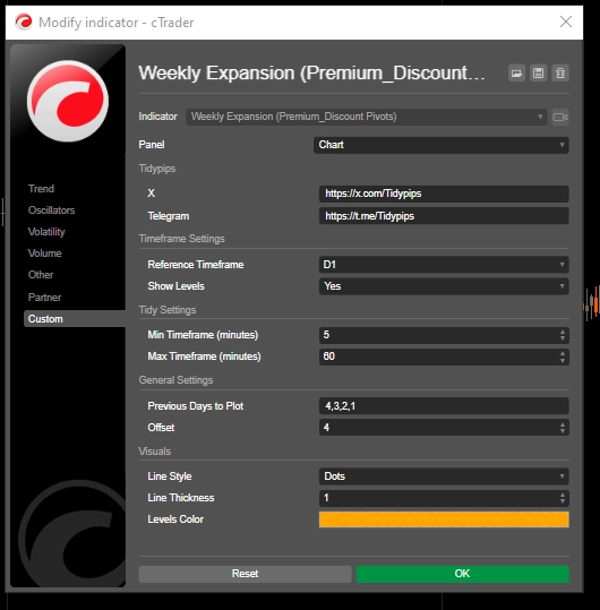
Özelleştirilebilir Referans Zaman Dilimi: Önemli fiyat seviyelerini çizmek için bir minimum ve maksimum zaman dilimi seçebilirsiniz, bu da günlük içi işlemlerinizi daha geniş piyasa trendleriyle hizalamanıza yardımcı olur.
Bu göstergenin özel kılan şey, haftalık mumun günlük bazda nasıl oluştuğunu takip edebilme yeteneğidir; bu da haftalık mumun genişlemesini yakalamayı kolaylaştırır.
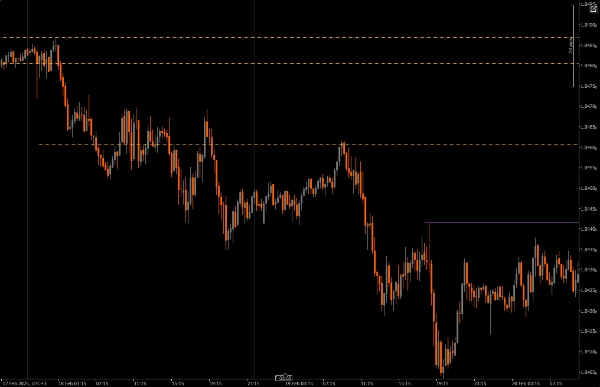
Ofset Parametresi: Bu özellik, çizilen seviyelerin gelecekte ne kadar ileriye uzanacağını belirlemenize olanak tanır ve potansiyel gelecekteki fiyat devamı bölgeleri hakkında daha net bir resim sunar.
Görsel Özelleştirme: Çizgi stillerini, kalınlığını ve renklerini ayarlamak için birçok seçeneğiniz var, böylece kişisel tarzınıza uygun ve okunması kolay bir grafik oluşturabilirsiniz.
Zaman Dilimi Kısıtlamaları: Gösterge, yalnızca belirttiğiniz zaman dilimi ayarları içinde çalışmasını sağlamak için kontroller içerir, böylece diğer zaman dilimlerine geçerken grafik karmaşasından kaçınabilirsiniz.
Dikkat Edilmesi Gerekenler:
Kişisel favori
Benim gibiyseniz ve grafiklerinizde rujdan uzak duramıyorsanız, bu göstergeyi deneyin. Zaman dilimi kısıtlamaları ve grafik karmaşasını azaltmaya yönelik geriye dönük dönem işlevselliği vardır.
Bu gösterge, haftalık mumun nasıl geliştiğini takip etmekte faydalıdır; Haftalık genişleme boğa emir akışı belirtileri gösteriyorsa, bu göstergedeki pivot seviyeleri boğa genişlemesine katılmak için alanları veya bölgeleri görselleştirir; benzer şekilde, haftalık genişleme ayı emir akışı gösteriyorsa, bu göstergedeki pivot seviyeleri ayı genişlemesine katılmak için alanları veya bölgeleri görselleştirir.
Kurulum: Öncelikle Previous Day Equilibrium'u cAlgo platformunuza indirip kurun.
Ayarlar: Referans zaman diliminizi seçmek için ayarları açın, kaç önceki günü çizmek istediğinizi belirleyin ve görsel ayarları istediğiniz gibi özelleştirin.
Analiz: İşlem yaparken, grafiğinizde çizilen seviyelere dikkat edin. Bu seviyeler, fiyatın geçmiş fiyat hareketlerine dayanarak nereden dönebileceğini gösterir ve daha bilinçli kararlar vermenize yardımcı olur.
Uygulama: Bu seviyeleri giriş ve çıkış noktalarınızı, ayrıca stop-loss ve kar al emirlerinizi belirlemek için kullanın ve bunları genel işlem stratejinize entegre edin.
Önerilen Yardımcı Araçlar:
cTrader: Previous Day Equilibrium'u kullanmak için en iyi platformdur, özelleştirme ve analiz için sorunsuz bir deneyim sunar.
Teknik Analiz Araçları: Bu göstergeleri hareketli ortalamalar veya osilatörler gibi diğer araçlarla eşleştirerek piyasa trendlerinin daha eksiksiz bir görünümünü elde edin.
Risk Yönetimi Araçları: Bu önemli seviyeler etrafında işlem yaparken riskinizi etkili bir şekilde yönetmek için hesaplayıcılar ve stop-loss araçlarını kullanın.
Previous Day Equilibrium'u bu araçlarla birlikte kullanarak, işlem stratejinizi geliştirebilir ve hızlı tempolu günlük içi işlem dünyasında başarı şansınızı artırabilirsiniz.
Özet
Müşteri değerlendirmeleri
5 | 0 % | |
4 | 100 % | |
3 | 0 % | |
2 | 0 % | |
1 | 0 % |


