
Description
Cet outil permet aux utilisateurs de spécifier une période d'analyse, telle que quotidienne, et de tracer les niveaux hauts et bas sur leurs graphiques avec des couleurs, styles et épaisseurs personnalisables. Il prend en charge plusieurs jours précédents, facilitant l'identification des zones d'action de prix significatives. L'indicateur propose également des étiquettes optionnelles pour plus de clarté, aidant les traders à prendre des décisions éclairées basées sur les données historiques des prix. Idéal pour les traders débutants comme expérimentés, cet outil améliore l'analyse du marché et les stratégies de trading.
Fonctionnalités
Période personnalisable : Les utilisateurs peuvent sélectionner une période spécifique (par exemple, quotidienne) pour analyser les hauts et bas précédents, permettant une visualisation adaptée à leurs stratégies de trading.
Plusieurs jours précédents : La possibilité de tracer les niveaux hauts et bas pour plusieurs jours précédents offre une vue complète des zones d'action de prix significatives.
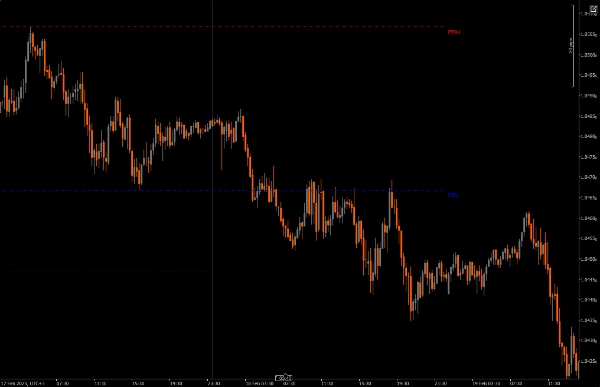
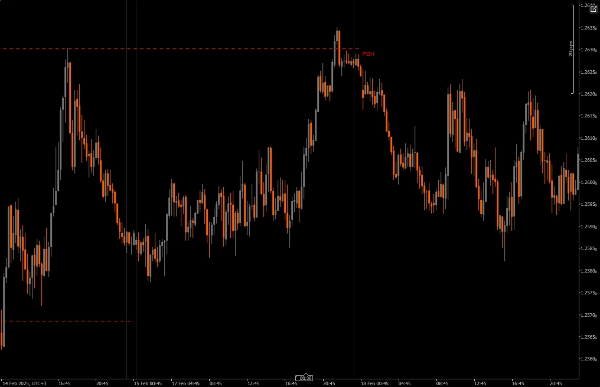
Lignes de tendance dynamiques : L'indicateur trace des lignes de tendance pour les hauts et bas de la journée précédente, facilitant l'identification rapide des zones potentielles de retournement.
Options d'étiquetage : Les utilisateurs peuvent activer des étiquettes pour afficher directement sur le graphique les valeurs actuelles des hauts et bas, améliorant la clarté et la compréhension.
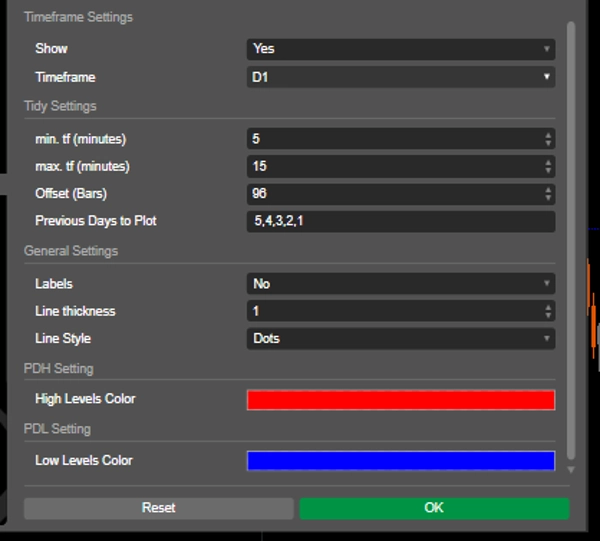
Personnalisation visuelle : Les traders peuvent personnaliser les couleurs, styles et épaisseurs des lignes selon leurs préférences pour améliorer la lisibilité du graphique.
Restrictions de période : L'indicateur garantit qu'il fonctionne uniquement dans les paramètres de période minimale et maximale spécifiés, réduisant l'encombrement du graphique lors du passage à d'autres périodes.
Points à noter
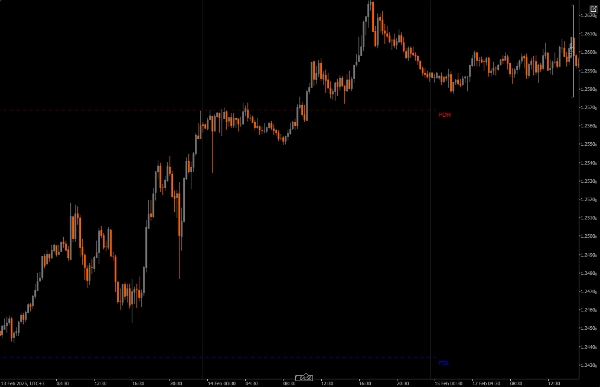
PDH ou PDL sur le marché peuvent être utilisés comme un draw on liquidity (DOL) ou pour encadrer un retournement.
Les retournements peuvent être encadrés à partir de PDH et PDL lorsqu'il y a un échec de déplacement.
Lorsque le prix respecte un ensemble PD au-dessus ou en dessous, échoue à dépasser un niveau haut ou bas quotidien, la bougie suivante peut être anticipée.
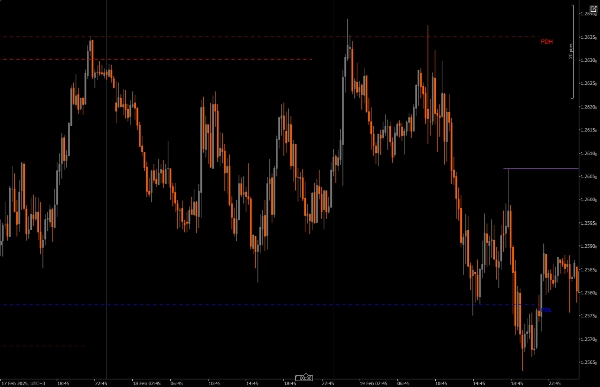
Le prix est-il plus susceptible d'atteindre le haut ou le bas du jour précédent ? Lors de l'utilisation de PDH PDL comme draw on liquidity (DOL)
Installation : Téléchargez et installez les Daily Range Liquidity Zones (PDH PDL) sur votre plateforme cAlgo.
Configuration : Ouvrez les paramètres de l'indicateur et sélectionnez la période souhaitée pour l'analyse, le nombre de jours précédents à tracer, et personnalisez les paramètres visuels comme la couleur et l'épaisseur des lignes.
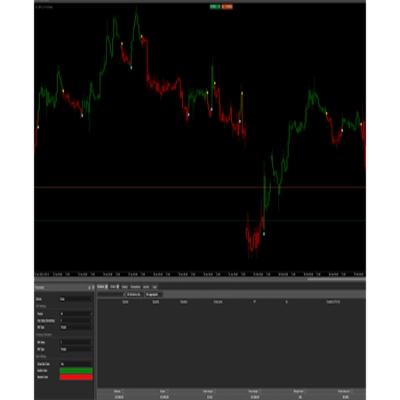
Utilisation de l'indicateur : L'indicateur tracera automatiquement les niveaux hauts et bas de la journée précédente sur votre graphique selon les paramètres spécifiés.
Analyse : Observez les niveaux tracés pendant que vous tradez. Utilisez ces niveaux pour encadrer les retournements potentiels et prendre des décisions de trading éclairées.
Outils complémentaires recommandés
cTrader : La plateforme native pour cAlgo, offrant un environnement fluide pour utiliser et personnaliser les indicateurs.
Outils d'analyse technique : Combinez cet indicateur avec d'autres outils comme Fair Value Gaps (FVG) et Reversal Pattern Indicators (CRT) pour améliorer votre stratégie de trading et votre analyse de marché.
Outils de gestion des risques : Utilisez des calculateurs de taille de position et des outils de stop-loss pour gérer efficacement le risque lors du trading autour des niveaux hauts et bas identifiés.
En intégrant les Daily Range Liquidity Zones (PDH PDL) avec ces outils, les traders peuvent améliorer leur analyse de marché et augmenter leurs chances de succès dans la navigation des complexités de l'action des prix.
Résumé
Avis clients
5 | 100 % | |
4 | 0 % | |
3 | 0 % | |
2 | 0 % | |
1 | 0 % |