RSI - EMA Crossover Signals
Chỉ báo
Phiên bản 1.0, Oct 2025
Windows, Mac
🎯 Tổng quan
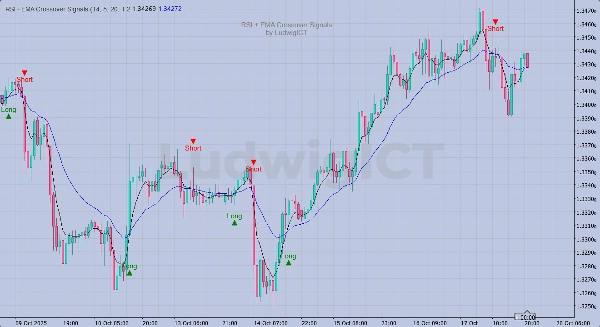
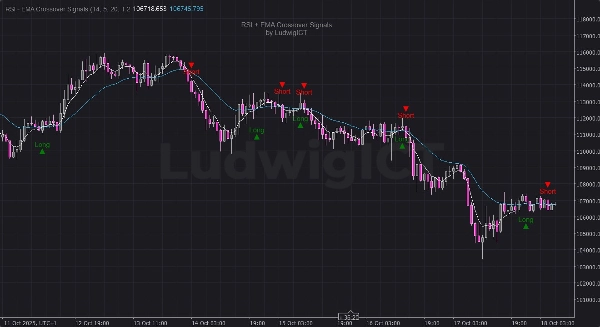
Chỉ báo RSI + EMA Crossover Signals của LudwigICT kết hợp đà và xác nhận xu hướng để tạo ra các tín hiệu giao dịch Mua/Bán với độ tin cậy cao — trực tiếp trên biểu đồ của bạn.
⚙️ Cách hoạt động:
- Giai đoạn tín hiệu RSI:
-
- Một tín hiệu được kích hoạt khi RSI cắt qua đường tín hiệu SMA của chính nó.
- Giai đoạn xác nhận EMA:
-
- Tín hiệu chỉ được kích hoạt khi các EMA nhanh và chậm cắt nhau theo cùng một hướng.
- Hủy tín hiệu:
-
- Bất kỳ sự cắt ngược nào (RSI hoặc EMA) sẽ hủy bỏ tín hiệu chưa được kích hoạt.
✨ Tính năng chính:
- 🔁 Logic xác nhận kép (RSI + EMA)
- 📈 Biểu tượng Mua và Bán rõ ràng được vẽ trực tiếp trên biểu đồ
- ⚡ Độ lệch trực quan dựa trên ATR động (tự động điều chỉnh theo biến động)
- 💧 Lớp phủ sạch với thương hiệu watermark cố định
- 🧠 Logic “kích hoạt” và “hủy bỏ” thông minh để giảm các tín hiệu sai
- 🧮 Các tham số RSI, EMA và độ lệch có thể điều chỉnh hoàn toàn
🔧 Các tham số đầu vào:
- Chu kỳ RSI (mặc định: 14)
- EMA nhanh (mặc định: 5)
- EMA chậm (mặc định: 20)
- Độ lệch tín hiệu (hệ số nhân ATR, mặc định: 1.2)
📊 Phù hợp cho:
- Nhà giao dịch theo đà
- Hệ thống xác nhận xu hướng
- Chiến lược giao dịch thủ công hoặc bán tự động
📅 Cập nhật phiên bản:
- ✅ Thêm độ lệch động dựa trên ATR để hình ảnh rõ ràng hơn
- ✅ Cải thiện logic độ chính xác tín hiệu
- ✅ Thêm watermark không thể gỡ bỏ để đảm bảo tính xác thực
© 2025 LudwigICT — Bảo lưu mọi quyền.
Hồ sơ chỉ báo
0.0
Đánh giá: 0
Đánh giá của khách hàng
Sản phẩm này chưa có đánh giá nào. Bạn đã dùng thử chưa? Hãy là người đầu tiên chia sẻ với mọi người!
BTCUSD
Forex
Signal
Breakout
Indices
EURUSD
Commodities
GBPUSD
NZDUSD
RSI
Scalping
Crypto
Stocks
XAUUSD
NAS100
ATR
MACD
USDJPY
Các sản phẩm có sẵn trên cTrader Store, bao gồm bot giao dịch, chỉ báo và plugin, được cung cấp bởi các nhà phát triển bên thứ ba và chỉ nhằm mục đích cung cấp thông tin và tiếp cận kỹ thuật. cTrader Store không phải là nhà môi giới và không cung cấp lời khuyên đầu tư, khuyến nghị cá nhân hay bất kỳ đảm bảo nào về hiệu suất trong tương lai.


![Logo "[Hamster-Coder] Moving Average MTF"](https://cdn.ctrader.com/image/webp/b11b98b1-194d-4b8e-b00e-d611826ad159_31226)


17.89M
Khối lượng đã giao dịch
60.07K
Pip đạt được
125
Lượt bán
4.67K
Cài đặt miễn phí