الوصف
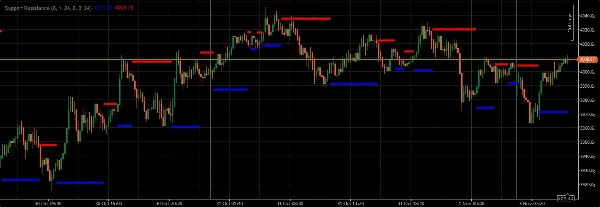
عند تداول الذهب، استخدم مستويات الدعم والمقاومة عبر أطر زمنية مختلفة (مخططات كبيرة، نطاقية، ومخططات تيك) لتحديد احتمالات اختراق نقاط المحور أو نقاط الدعم/المقاومة. قم دائمًا بتأكيد هذه الإشارات باستخدام مؤشرات فنية أخرى مثل المتوسطات المتحركة، المذبذبات، ونماذج الشموع لمزيد من الصفقات ذات الاحتمالية الأعلى
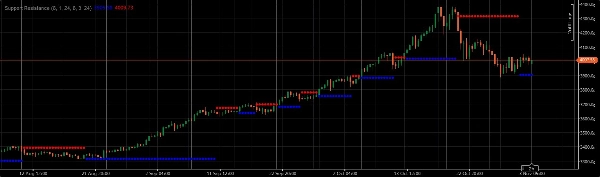
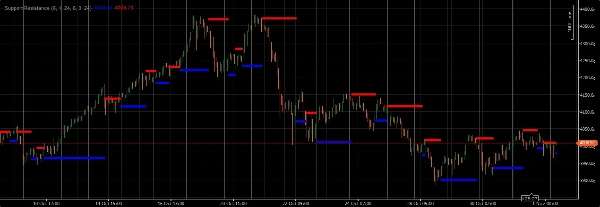
عند تداول الذهب، استخدم مستويات الدعم والمقاومة عبر أطر زمنية مختلفة (مخططات كبيرة، نطاقية، ومخططات تيك) لتحديد احتمالات اختراق نقاط المحور أو نقاط الدعم/المقاومة. عند تداول الذهب، استخدم مستويات الدعم والمقاومة عبر أطر زمنية مختلفة (مخططات كبيرة، نطاقية، ومخططات تيك) لتحديد احتمالات اختراق نقاط المحور أو نقاط الدعم/المقاومة. يمكن أن تعمل هذه المستويات، بمجرد تحديدها، كنقاط قرار حاسمة. يشير الاختراق فوق المقاومة أو تحت الدعم، خاصةً عندما يصاحبه زيادة في جسم الشمعة، غالبًا إلى استمرار الاتجاه أو تحول كبير في معنويات السوق. وعلى العكس من ذلك، يمكن أن يشير الارتداد من مستوى الدعم أو الرفض عند المقاومة إلى انعكاس محتمل أو استمرار في التماسك الحالي. قم دائمًا بتأكيد هذه الإشارات باستخدام مؤشرات فنية أخرى مثل المتوسطات المتحركة، المذبذبات، ونماذج الشموع لمزيد من الصفقات ذات الاحتمالية الأعلى. علاوة على ذلك، انتبه جيدًا للأحداث الإخبارية وإصدارات البيانات الاقتصادية، حيث يمكن أن تؤثر بشكل كبير على أسعار الذهب وتلغي الإعدادات الفنية البحتة. إدارة المخاطر أمر بالغ الأهمية؛ لا تخاطر أبدًا بأكثر من نسبة صغيرة من رأس مال التداول الخاص بك في أي صفقة واحدة.
الملخص
تقييمات العملاء
5 | 100 % | |
4 | 0 % | |
3 | 0 % | |
2 | 0 % | |
1 | 0 % |


