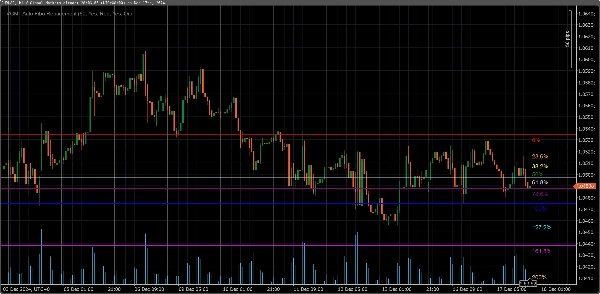
VGM - Auto Fibo Retracement
「VGM - Auto Fibo Retracement」ロゴ
4.5
03/09/2025
824
Desktop
登録日 17/12/2024
無料インストール
824
「VGM - Auto Fibo Retracement」アップロード画像

This Auto Fibonacci Retracement Indicator automatically calculates and draws Fibonacci retracement levels on the chart based on the highest high and lowest low within a customizable lookback period. Users can configure colors and enable/disable specific Fibonacci levels, including popular extensions above 100% such as 127.2%, 161.8%, 200%, and 261.8%.

Key Features:
1. **Automatic Swing Detection**: Detects swing highs and lows dynamically within the chosen lookback period.
2. **Customizable Levels**: Enable/disable specific Fibonacci levels as per preference.
3. **Color Settings**: Choose individual colors for each level for better visual distinction.
4. **Extended Levels**: Includes commonly used extensions (127.2%, 161.8%, 200%, and 261.8%) for trend continuation analysis.
5. **Real-Time Updates**: Levels automatically adjust to changes in market conditions.

Ideal For:
- Traders using Fibonacci retracement and extensions for entry/exit levels.
- Users who need a clean, flexible, and automated Fibonacci tool.


Build by VantoFX. https://vantofx.com Free for all.

4.5
レビュー: 2
5
50 %
4
50 %
3
0 %
2
0 %
1
0 %
カスタマーレビュー
August 10, 2025
This is helpful my friend, thanks for the upload :)
July 9, 2025
Pros: Automatically detects swing points and plots Fibonacci retracement levels. Easy to use, customizable, works across timeframes. Cons: No tooltips or alerts. Lacks template saving and historical swing tracking. Requires additional confirmation tools for reliable trading.
これも好きかも
インジケーター
NAS100
NZDUSD
RSI
+11
Pattern Signal Forex
Indicator pattern signal moment
インジケーター
Grid
NAS100
XAUUSD
+6
AutoFibRetracement
A powerful overlay tool designed to automatically plot Fibonacci retracement levels based on a custom window.
trPDHLC
this indicator shows previous day high low and closed with precise manner.
Lozano Price Action
LPA simplifies trading by coloring candles with volume data and RSI levels for trend and reversal insights.
インジケーター
Indices
Stocks
Commodities
+2
SymbolTFOverlay
The SymbolTFOverlay display the current symbol and timeframe as a semi-transparent text overlay on the chart.
Supply Demand Premium V2_NSC
The long awaited new and improved Supply Demand Premium V2 indicator. Unlock greater trading opportunities now!
Fury Team E_M_A_su_TF
EMA ON TF (MULTI-TIMEFRAME)
Renko 4k Pips
Custom your Renko Brick how do you wish!
LT_FairValueGap
Detects valid Fair Value Gaps from strong 3-bar patterns. Keep drawing unfilled gaps until price fills them.
インジケーター
Grid
NAS100
NZDUSD
+17
Institutional Volume Supply Demand
Volume Profile Supply Demand
Head Shoulders Finder
Detects Head & Shoulders patterns, plots signals, and alerts for trading opportunities.
LDE - Market Sessions
🇫🇷 Visualisez vos sessions de marché et OPR d'un coup d’œil 🇬🇧 Visualize your market sessions & OPR at a glance !
インジケーター
XAUUSD
Commodities
Forex
+5
BullBear Dynamics
BullBear Dynamics helps traders detect and interpret the balance between bullish and bearish momentum
[Hamster-Coder] Pivot Points MTF
[Hamster-Coder] Pivot Points (Multi Time Frame)
インジケーター
NAS100
NZDUSD
XAUUSD
+14
MacD Custom Indicator Multi Time Frame
MacD Custom Indicator-Multiple Time Frame+All Available Options!
E7 Polynomial Regression Channel
Polynomial Regression Channel which also reflects the volatility of the underlying asset.
インジケーター
Indices
Commodities
Stocks
+2
XY Bar Info Panel v1.5
Overlay panel showing bar date/time, OHLC, tick Volume, percent change, and market session - fully customizable.
インジケーター
Indices
Prop
Breakout
+7
NTNPICLL
NTNPICLL is a tool to check the best trading hours for the assets and also includes the highest and lowest point