
Deskripsi
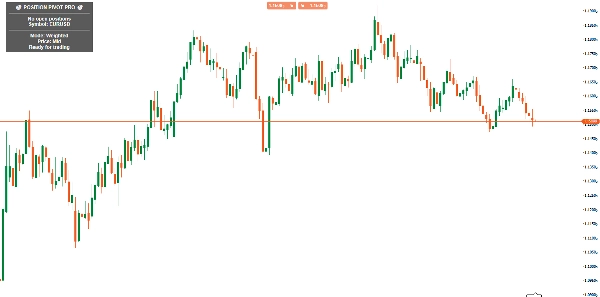
Position Pivot Pro adalah alat manajemen posisi canggih yang dirancang untuk trader yang melakukan beberapa entri pada aset yang sama. Indikator ini secara otomatis menghitung titik pivot rata-rata dari semua posisi terbuka, memberikan referensi visual penting pada grafik.
Fitur Utama:
- Perhitungan Pivot Waktu Nyata:
-
- Rata-Rata Sederhana: Rata-rata aritmatika harga entri
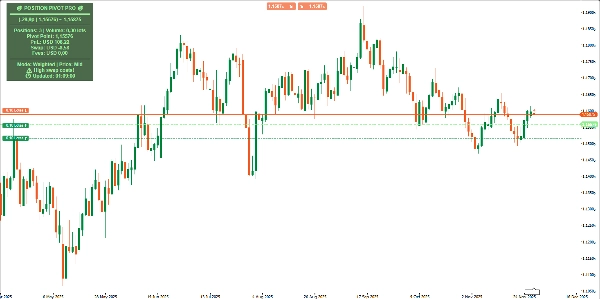
- Rata-Rata Tertimbang Volume: (Default) Mempertimbangkan volume setiap posisi untuk pivot yang lebih akurat
- Garis grafik dinamis yang menyesuaikan secara otomatis
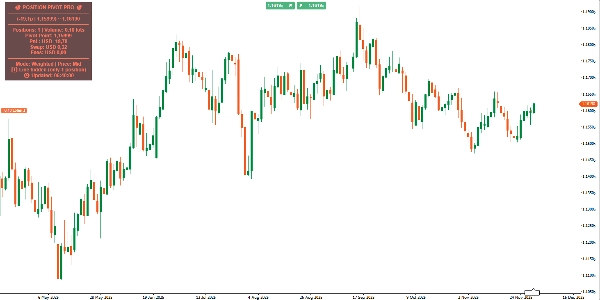
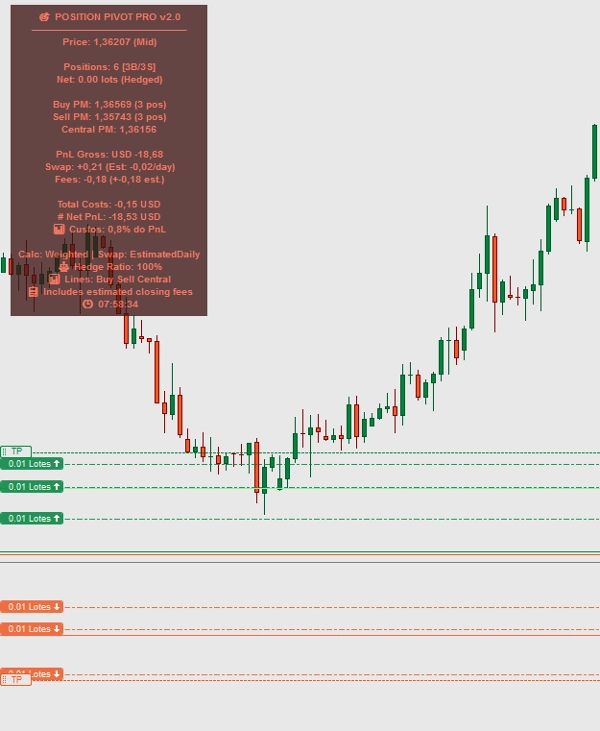
- Panel Informasi Lengkap:
-
- Menampilkan titik pivot yang dihitung
- Menunjukkan kekuatan pergerakan dalam pips (jarak dari harga saat ini)
- Total posisi dan volume dalam lot
- Laba/Rugi belum direalisasi, swap terakumulasi, dan total komisi
- Sistem Peringatan Biaya:
-
- Peringatan visual saat komisi atau swap melebihi batas yang dapat dikonfigurasi
- Peringatan untuk biaya absolut yang tinggi
- Warna dinamis (hijau/untung, merah/rugi, netral)
- Karakteristik Teknis:
-
- Zero Lag: Perhitungan waktu nyata tanpa penundaan
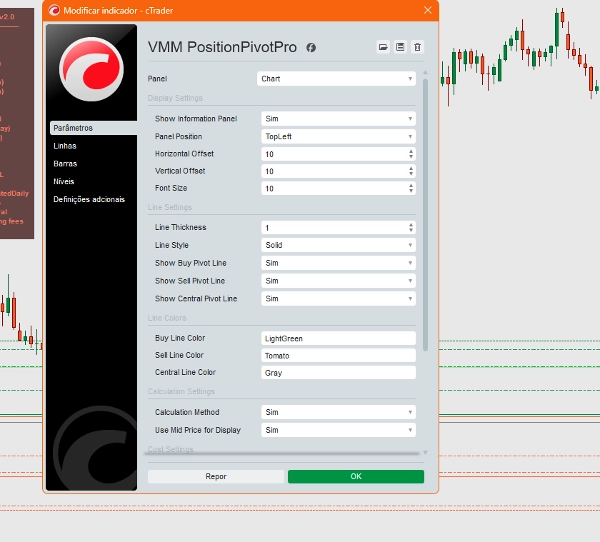
- Sepenuhnya Dapat Disesuaikan: Posisi panel, warna, ketebalan garis
- Mode Harga Mid/Bid: Pilih referensi perhitungan
- Pembaruan otomatis dengan perubahan posisi
Manfaat Trader:
- Pengambilan keputusan lebih cepat dengan tampilan terkonsolidasi dari semua posisi
- Manajemen risiko yang lebih baik dengan mengidentifikasi titik impas
- Optimasi biaya dengan pemantauan swap dan komisi
- Analisis kekuatan pergerakan relatif terhadap pivot
Kasus Penggunaan:
- Scaling in/out: Mengidentifikasi harga rata-rata ideal untuk menambah/mengurangi posisi
- Manajemen hedge: Memantau posisi berlawanan secara bersamaan
- Trading tren: Melacak perkembangan entri bertahap
- Day trading: Kontrol tepat atas beberapa perdagangan intraday
Sempurna untuk trader yang menggunakan pyramiding, martingale, atau strategi entri ganda, mengubah data kompleks menjadi informasi yang dapat ditindaklanjuti langsung di grafik.
Ringkasan
Profil indikator
Ulasan pelanggan
0.0
Ulasan: 0
Ulasan pelanggan
Belum ada ulasan untuk produk ini. Sudah mencobanya? Jadilah pemberi ulasan pertama!
Diskusi
Pertanyaan umum
BTCUSD
Forex
Indices
EURUSD
Commodities
GBPUSD
NZDUSD
Crypto
Stocks
XAUUSD
NAS100
USDJPY
Produk-produk yang tersedia melalui cTrader Store, termasuk bot trading, indikator, dan plugin, disediakan oleh pengembang pihak ketiga serta hanya ditujukan untuk akses teknis dan informasi. cTrader Store bukan broker dan tidak menyediakan saran investasi, rekomendasi pribadi, atau jaminan apa pun tentang kinerja di masa mendatang.
Produk lain dari penulis ini


Harga
Sejak 28/12/2024
54
Instal gratis