

説明
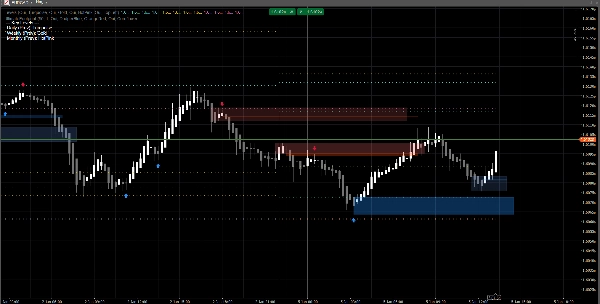
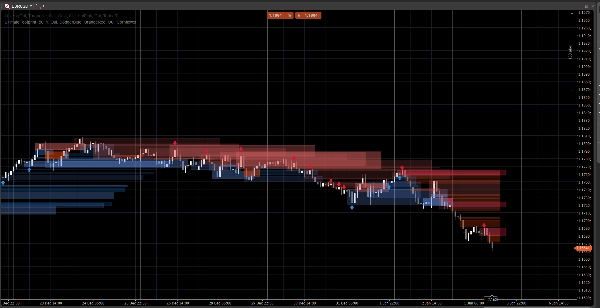
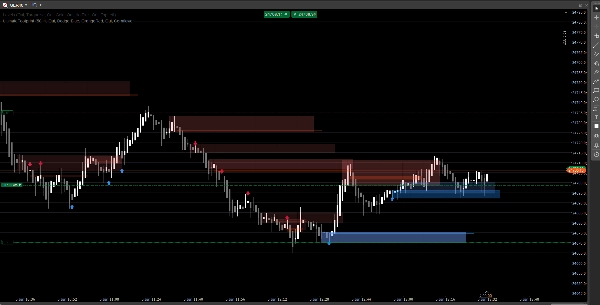
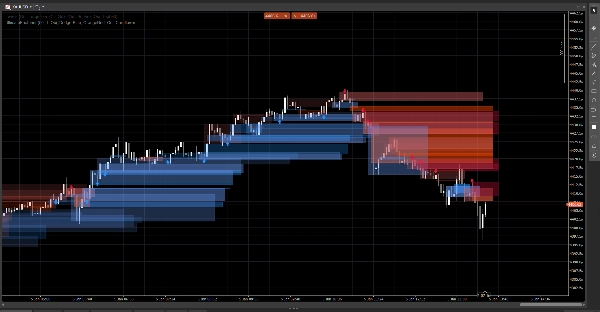
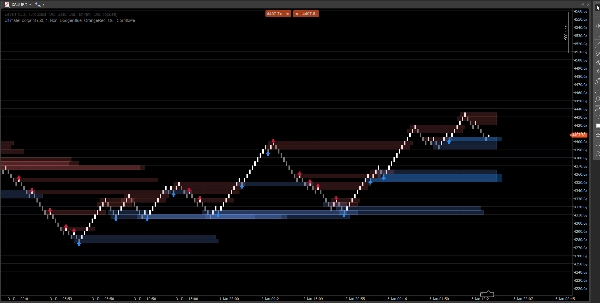
価格ギャップ、オーダーブロック、およびブレイクアウトベースのシグナルを表示するクリーンな市場構造システムで、オプションでボリューム確認とリテストアラートを備えています。標準チャートとレンコの両方で明確に表示されるように構築されています。
このインジケーターは読みやすさと実行に焦点を当てており、混乱を避けています。ゾーンは前方に拡張され、自動的に管理(期限切れ/無効化)されるため、価格が展開する間に重要なレベルを追跡するのに役立ちます。
検出内容
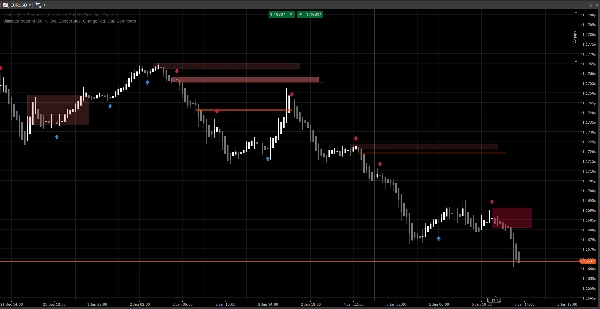
価格ギャップ(3本バーの非効率性)
- チャート上に強気および弱気のギャップを直接ハイライト
- 表示はオプション(オン/オフ切替可能)
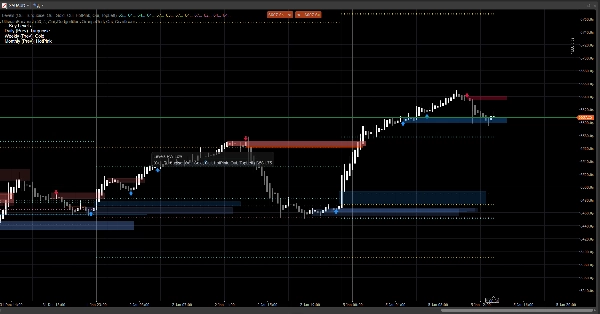
オーダーブロック(変位前の最後の反対のローソク足)
- 強気および弱気のOBゾーン
- 無効化されるか最大拡張に達するまで自動的に前方に拡張
構造ブレイクシグナル(スイングブレイクアウトロジック)
- スイングの高値/安値を使用したブレイクアウトベースの検出
- 新しいオーダーブロックが確認されるとシグナル矢印(上/下)を表示
リアルタイム更新
- ライブ環境でスムーズに更新されるよう設計
- クラシックキャンドルで動作し、レンコスタイルの価格アクションでも良好に機能
スマートフィルタリング(オプション)
ボリューム確認
- オーダーブロックシグナルを検証する前にボリュームZスコアの確認を要求可能
- 調整可能なベースラインと感度
アラート(オプション)
以下のアラートを有効にできます:
- 新しいオーダーブロック検出時
- 方向付きのオーダーブロックリテスト(拒否ローソク足)
使い方(シンプルなワークフロー)
- 価格ギャップとオーダーブロックを反応ゾーン(注目エリア)として使用します。
- シグナルが構造のブレイクと対応するOB形成を強調表示します。
- リテストアラートを使用して、拒否動作を伴うゾーンへの戻りをキャッチします。
- 独自のエントリー/エグジットと組み合わせて使用します(リスク管理はご自身の責任です)。
入力概要
ボリュームロジック
- ボリュームベースライン:Zスコア計算に使用される平滑化期間
- ボリューム感度:ボリュームがゾーンの可視性に与える影響の強さを制御
価格ギャップ
- 価格ギャップを表示
- 強気/弱気ギャップの色
オーダーブロック
- OBを表示
- 強気/弱気OBの色
- 最大拡張:ゾーンが前方にどれだけ拡張されるか
シグナル
- 矢印を表示
- スイングルックバック:スイング検出ウィンドウを定義
- ボリューム確認を要求(オプション)
- ボリューム閾値 + ボリューム期間
- シグナルの色
- ゾーンの透明度
- 最大拡張バー数(シグナル)
アラート
- アラートを有効にする
- 新しいOBのアラート
- リテストのアラート
よくある質問(FAQ)
1) 再描画されますか?
いいえ。
バーが閉じた後に過去のシグナルを新しい位置に「移動」することはありません。
- ゾーン(ギャップ/OBの矩形)は過去のバーから作成され、前方に拡張されます。
- シグナル(矢印)はクローズしたバーの条件(スイングブレイク+OB選択)から確認されます。
一度矢印が表示されると、遡って位置が変更されることはありません。
重要なニュアンス(通常の動作):
現在のバーがまだ形成中の場合、価格(高値/安値/終値)は変動する可能性があります。これにより以下が発生します:
- ゾーンの右端の拡張が更新される(視覚的な拡張)、
- リテスト条件が一時的に真から偽に変わることが同じ形成中のバーで起こる。
これは再描画ではなく未完成のローソク足でのリアルタイム更新です。
2) ここでの「再描画」と「再ペイント」の違いは何ですか?
再描画=はい(設計上)。
再ペイント=いいえ。
- 再描画は、矩形がチャート上で再描画/拡張され、ゾーンが未来に投影され続けることを意味します。これはライブの「フットプリント」スタイルのオーバーレイに必要です。
- 再ペイントは、過去に確認されたシグナル(矢印/ゾーン)が後から変更されることを意味しますが、これは起こりません。
3) なぜゾーンの形状や不透明度が時々変わるのですか?
ゾーンはボリューム加重されており、Zスコアモデルを使用しているためです:
SMA(volume)+StdDev(volume)をベースライン期間で計算- 不透明度/アルファはボリュームの偏差に応じて変化
したがって、以下を変更すると:
- ボリュームベースライン
- ボリューム感度
- またはシンボルフィードが異なる場合
視覚的な強度が変わることがあります。ゾーンの位置は価格ベースのままで、可視性はボリュームの文脈を反映できます。
4) なぜアラートが時々「欠落」または「オフ」になるのですか?
意図的な3つの技術的理由があります:
A) アラートは厳格な合致条件を必要とします
リテストアラートの場合、インジケーターは以下を要求します:
- 価格がOBゾーンと重なり、かつ
- 拒否ローソク足の条件が満たされる(例:強気拒否は
Close > Open)
価格がゾーンに触れても終値が中立または逆の場合、リテストアラートは発生しません。
B) 一度きりのアラートロジック(スパム防止)
各OBには内部フラグ(例: Alerted)があり、すべてのティックで繰り返しアラートが発生しないようにします。
最初のタッチが拒否ルールを満たさず、後で満たしてもフラグが既に設定されている場合(バージョンによる)、アラートが「オフ」のように見えることがあります。
C) チャートタイプの動作(レンコ/ティック集計)
レンコでは「現在のブリック」はクラシックなローソク足ではありません。形成中に:
- 始値/終値が不安定または等しい場合がある
- リテストロジックはバー内で発生しても終値で確認されないことがある
ライブ取引では、最大の信頼性のために:
- 新しいOBアラートは通常クリーンです
- リテストアラートは「確認された拒否」アラートとして扱うのが最適です(単なるヒゲのタッチではありません)
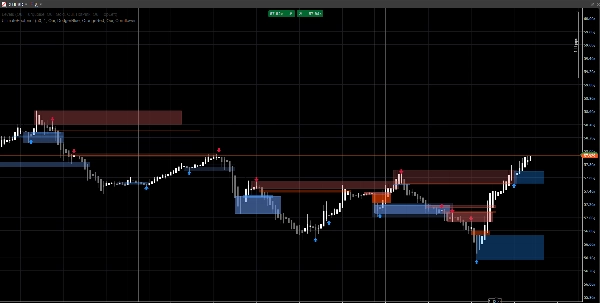
5) スクリーンショットでなぜ一部のOBに矢印が表示されない(またはすべてのOBに矢印が一致しない)のでしょうか?
それは、ゾーンと矢印は同じエンジンではないからです:
- ゾーン(OB矩形)はゾーン検出ロジック(ギャップ由来のOB/価格アクションゾーン)から表示されます。
- 矢印は構造イベントが検出されたときのみ表示されます:
-
- スイング高値/安値が破られる(構造のブレイク)、
- その後アルゴリズムが遡って最後の反対のローソク足=有効なOBを探す。
したがって、以下の場合は矢印なしのOBゾーンが表示されることがあります:
- 検証されたスイングブレイクがなかった、
- OB候補がボリュームフィルター(有効の場合)を満たさなかった、
- またはギャップエンジンによって作成されたゾーンで構造エンジンによって確認されていない。
これがこのツールが役立つ理由です:
ゾーンは地図を提供し、矢印は最も合致度の高い瞬間を強調します。
6) OBを常に矢印と一致させることはできますか?
はい、技術的には不要なゾーンレイヤーを無効にして「シグナルのみ」モードで実行できます:
- 構造駆動のゾーンのみが欲しい場合は価格ギャップをオフにします
- 矢印で確認されたOBのみが欲しい場合はOB表示(ゾーン)をオフにします
7) すべての時間枠とシンボルで動作しますか?
はい、ただし結果は以下に依存します:
- ボラティリティ、
- 流動性、
- ティックボリュームの品質、
- および市場セッション。
暗号通貨と指数はFXとは異なる動作をします。
注意事項と免責事項
このインジケーターは視覚的な意思決定支援ツールであり、シグナルサービスや金融アドバイスではありません。
すべての市場と時間枠は異なる動作をするため、常にご自身のデータで検証し、適切にリスク管理を行ってください。過去の動作は将来の結果を保証するものではありません。
概要
カスタマーレビュー
5 | 100 % | |
4 | 0 % | |
3 | 0 % | |
2 | 0 % | |
1 | 0 % |


![「Gaussian Channel [Iridio Capital]」ロゴ](https://cdn.ctrader.com/image/webp/7c039209-5573-4a54-a072-f9528b503103_41960)


