Descripción
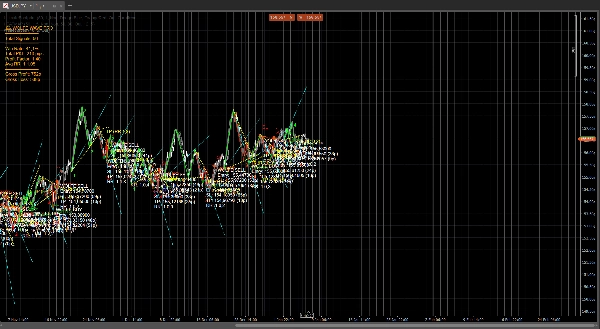
Wolfe Wave Pro es un indicador diseñado para detectar, validar y visualizar automáticamente patrones Wolfe Wave en tiempo real, con un panel de rendimiento.
Construido principalmente para mercados Forex, esta herramienta transforma un patrón tradicionalmente discrecional en un enfoque estructurado basado en reglas.
Concepto Principal
Las Wolfe Waves son un patrón natural de estructura de mercado basado en:
- simetría de precios,
- líneas de tendencia convergentes,
- y dinámicas de reversión a la media.
Wolfe Wave Pro automatiza este proceso mediante:
- Identificación de puntos de giro usando un motor ZigZag adaptativo
- Validación de estructuras Wolfe Wave de 5 puntos alcistas y bajistas
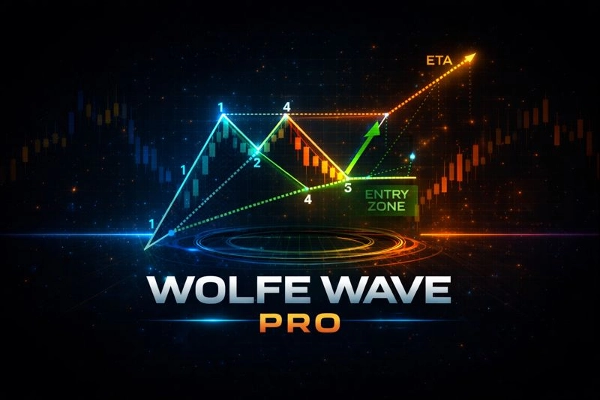
- Proyección de niveles de Entrada, Stop Loss y Objetivo (ETA)
- Seguimiento de métricas de rendimiento en un panel en vivo
Sin conjeturas. Sin dibujo manual. Sin patrones retrospectivos.
Características Clave
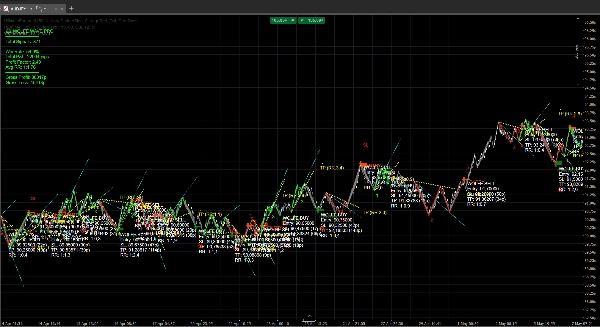
🔹 Detección Automática de Wolfe Wave
- Detecta Wolfe Waves alcistas y bajistas basadas en la estructura de giro
- Usa Profundidad y Desviación ZigZag configurables para adaptarse a diferentes condiciones de mercado
- Filtra estructuras inválidas o de baja calidad usando reglas basadas en el precio
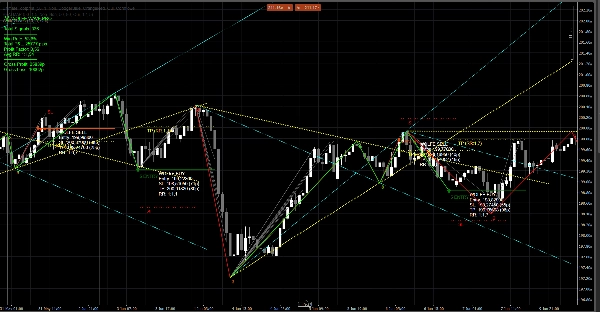
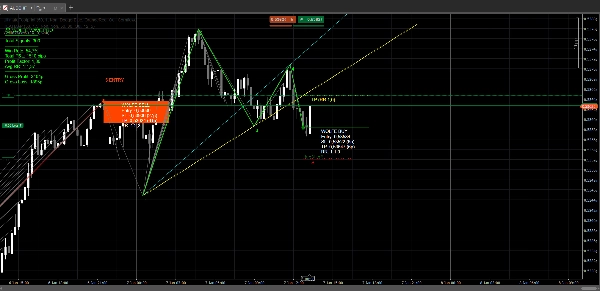
🔹 Marco Completo de Operaciones
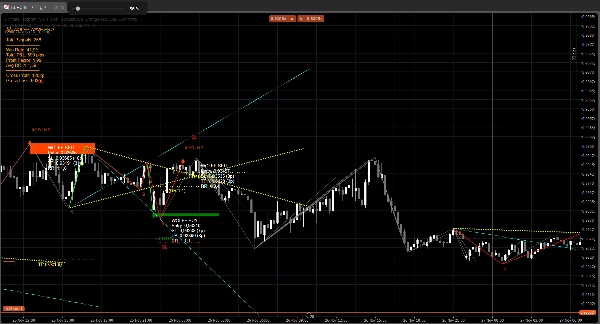
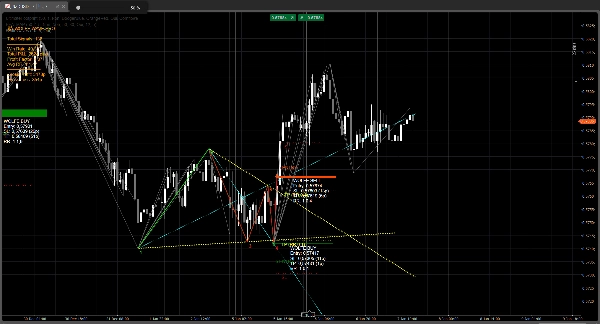
Para cada Wolfe Wave validada, el indicador muestra automáticamente:
- Etiquetado de puntos 1–5
- Zona de Entrada alrededor del Punto 5
- Stop Loss (basado en la estructura)
- Proyección de Objetivo (línea ETA)
- Cálculo de la relación Riesgo/Recompensa (RR)
- Flecha de entrada para claridad visual
Todo se traza directamente en el gráfico para una ejecución inmediata.
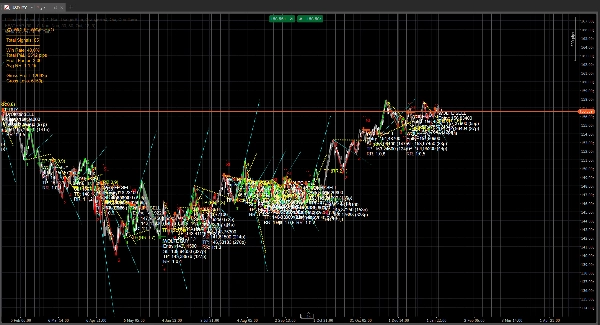
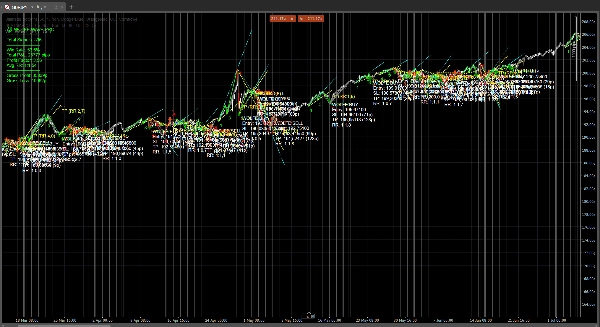
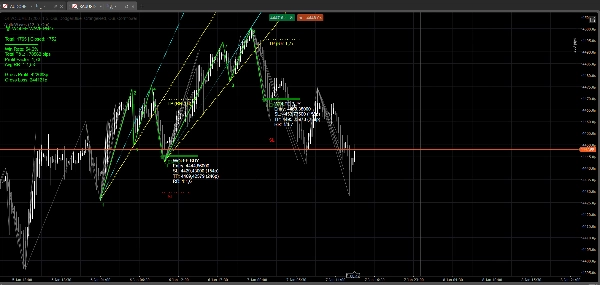
Panel de Rendimiento (Integrado)
Wolfe Wave Pro incluye un panel de estadísticas en vivo, que rastrea:
- Total de señales detectadas
- Tasa de éxito
- P&L total (en pips)
- Factor de Ganancia
- Promedio Riesgo/Recompensa
- Ganancia Bruta y Pérdida Bruta
- Estado de operaciones Abiertas / Ganadas / Perdidas
Esto te permite evaluar objetivamente el comportamiento de las Wolfe Waves a través de pares y marcos temporales. Por favor, ten en cuenta que las Wolfe Waves no son adecuadas para cada activo. Algunos son más reactivos que otros. En general, los pares FX son
Diseñado Para
- Traders de Forex
- Gráficos Normales, Renko y Heiken Ashi
- Soporte para múltiples marcos temporales (desde M1 para activos líquidos hasta H4)
- Traders que valoran estructura, geometría y asimetría de riesgo
- Usuarios que buscan sistemas basados en patrones con estadísticas, no solo dibujos
Notas Técnicas
- Los patrones se detectan usando puntos de giro
- Las líneas y zonas se actualizan en tiempo real conforme evoluciona el precio
- El panel se actualiza dinámicamente basado en la interacción del precio con los niveles proyectados de SL/TP
- Las estadísticas de rendimiento son indicativas y para análisis
Personalización
- Sensibilidad ZigZag ajustable
- Visualización opcional del panel
Descargo de responsabilidad
Este indicador es una herramienta de apoyo a la decisión, no un servicio de señales de trading ni un consejo financiero. Las Wolfe Waves son probabilísticas por naturaleza y requieren una gestión adecuada del riesgo.