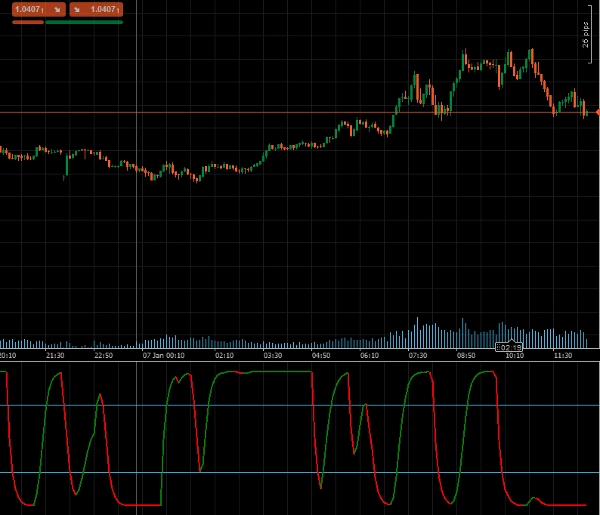
00
Days
:
00
Hours
:
00
Minutes
:
00
Seconds
STC
Indikator
278 muat turun
Version 1.0, Jan 2025
Windows, Mac
5.0
Ulasan: 2
Imej yang dimuat naik "STC"
Sejak 24/09/2024
4.16K
Pemasangan percuma

The Schaff Trend Cycle (STC), developed by renowned technical analyst Doug Schaff, is an advanced trading indicator designed to identify market trends and reversals with exceptional speed and precision. Rooted in the innovative idea of combining trend and cycle components, the STC leverages exponential moving averages (EMAs) and stochastic calculations to overcome the limitations of lagging indicators like MACD or Stochastic Oscillator. This unique approach provides earlier, more reliable trading signals, offering a significant edge in trend detection and market analysis.

Key Features:

  • Early Trend Detection: Combines exponential moving averages (EMAs) with stochastic calculations to capture trends faster.
  • Customizable Settings: Adjust length, fast MA, slow MA, MA type and smoothing factor to suit your trading strategy.
  • Visual Alerts: Dynamic color changes indicate bullish or bearish trends, making it easy to interpret market conditions.
  • Support for Overbought/Oversold Levels: Built-in levels (25 and 75) help identify potential market turning points.

Parameters

  • Length: Defines the number of periods for trend calculation.
  • Fast MA Length: Sets the length of the fast-moving average.
  • Slow MA Length: Specifies the length of the slow-moving average.
  • MA Type: Allows selection of the moving average type (e.g., EMA, SMA).
  • Smooth Factor: Adjusts the smoothing factor for refined trend signals.

Outputs

  • STC: Outputs the primary Schaff Trend Cycle value, representing trend direction and strength, for programmatic use in automated trading systems.
  • STCBull: Highlights bullish trend conditions.
  • STCBear: Highlights bearish trend conditions.


5.0
Ulasan: 2
5
100 %
4
0 %
3
0 %
2
0 %
1
0 %
Ulasan pelanggan
August 12, 2025
Pros: Fast and accurate trend detection, earlier signals than MACD, customizable levels. Cons: No alerts, no MTF mode, no trade statistics.
MACD

Lebih banyak produk daripada penulis ini

Indikator
Breakout
PDHL
PDHL - Previous Day High&Low
DataWindow
An MT-style Data Window for enhanced data visualization – hope this will be helpful!
Logo "ColorfulTickVolume"
Dinilai teratas
5.0
(3)
Percuma
ColorfulTickVolume
Change the color of Tick Volume based on the price movement

Anda juga mungkin suka

Indikator
RSI
Commodities
Signal
+1
Dot Momentum %BB Indicator
Dynamic circles visualize price's volatility position. Like RSI for market overextension & stretch. Quantify context.
Candle Timer & Strength Panel Demo -
Candle Timer & Strength Panel DEMO for cTrader DEMO VERSION – 24 hours free trial! This is a DEMO version of the Candle
Vsamarth Indi
One‑click RSI robot for consistent rapid‑fire trades.
Big Candel
1 Candel High Time Freme
Indikator
NAS100
NZDUSD
XAUUSD
+11
SwingHighLowDetector
Introducing High Accuracy multi timeframe Swing high and low detector.
Indikator
Grid
NAS100
NZDUSD
+17
Institutional Volume Supply Demand
Volume Profile Supply Demand
Indikator
Breakout
Fx4U.Multi TimeFrame Support & Resistance
Allow trader to visualize Support & Resistance across different timeframes,give trader an overview of the current market
Indikator
Indices
FVG
Stocks
+4
FAIR VALUE GAP INDICATOR
Pinpoint FVGs, track fills and see mitigation stats — trade imbalances with clarity and confidence.
Indikator
Forex
EURUSD
SMC
SMCTimingIndicator
Customizable cTrader indicator for marking trading sessions with vertical lines.
Logo "Vwap PRO"
Dinilai teratas
5.0
(2)
Percuma
Indikator
VWAP
NAS100
Indices
+8
Vwap PRO
VWAP Pro – The Ultimate VWAP 💎💰
Indikator
NAS100
NZDUSD
XAUUSD
+14
Volume Profile Pivot Anchored
Anchor volume profiles to pivots with POC, VAH, VAL and real-time insights for clearer trade decisions.
Indikator
Indices
Prop
Stocks
+5
New Way Sar - Free
The Parabolic SAR, or "Stop and Reverse," is a dynamic technical analysis tool.
Sejak 24/09/2024
4.16K
Pemasangan percuma