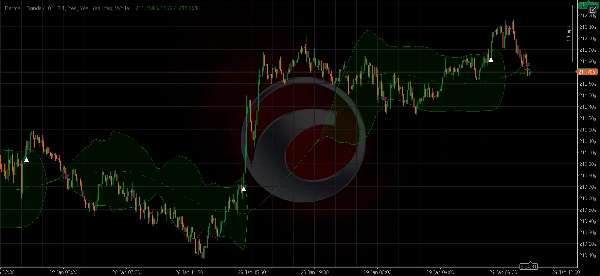
Bermaui.
インジケーター
Version 1.0, Jan 2026
Windows, Mac
「Bermaui.」アップロード画像
登録日 28/01/2026
トライアルバージョンについて
No Alerts And Arr.

Bermaui Bands (BB) is a technical analysis tool that helps filter between ranging and trending price movements. The idea behind this indicator can be explained in the next steps -

  1. Calculate Standard Deviation as an oscillator that moves between 0 and 100. Will name it Bermaui Deviation percent (BD percent).
  2. If "BD percent" is near zero then volatility is at its extreme. In addition, if "BD percent" is near 100 then volatility is very low.
  3. High volatility means a great probability for a trending market, while low volatility means side-way or ranging market.
  4. Middle Line is a Simple Moving Average because Standard Deviation is calculated depending on Moving Average.
  5. Add "BD percent" to a simple moving average with the same number of bars in the calculation to get The Upper Bermaui Band.
  6. Subtract "BD percent" from a simple moving average with the same number of bars in the calculation to get The Lower Bermaui Bands.
0.0
レビュー: 0
カスタマーレビュー
この商品にはまだレビューがありません。お使いになったことがある方は、ぜひレビューをお願いします。
Indices
Breakout
Commodities
Stocks
Forex
Signal
Crypto

これも好きかも

インジケーター
NAS100
NZDUSD
Breakout
+12
ATR Bands
Enhance trading with ATR Bands! Visualize market volatility using dynamic upper and lower ATR bands for precise decision
インジケーター
VWAP
Indices
RSI
+4
ProVWAP
Advanced Anchored VWAP for cTrader: volatility bands, real‑time alerts & customizable session resets.
インジケーター
NAS100
NZDUSD
XAUUSD
+13
SupportResistance
Auto-detect support and resistance & trendlines, highlight pullbacks/BOS retests, and filter with candle confirmation.
インジケーター
NAS100
NZDUSD
Breakout
+18
Free Smart Money Concepts (SMC) from TradingView
Free Smart Money Concepts from TradingView for cTrader: BOS/CHoCH, OB, FVG, liquidity, MTF levels, discount zones.
インジケーター
Indices
RSI
Stocks
+5
REDGREENZONEREVERSAL
The Red & Green Zone Reversal Indicator detects overbought and oversold market conditions using Bollinger Bands and RSI.
インジケーター
Grid
NAS100
NZDUSD
+16
Frac Support Resistance V1
Smart Support/Resistance lines auto calculated from D1/H4/H1/M15. Highly customizable visuals + built in Backtest Mode.
インジケーター
NAS100
XAUUSD
Commodities
+10
EWMA
Professional EWMA Volatility Indicator - RiskMetrics™ Inspired Exponential Smoothing
インジケーター
NAS100
NZDUSD
Martingale
+26
Trend & Volume Regime Map
Trend & Volume Regime Map – A normalized price & volume regime map for cTrader that scores trend from –10 to +10, colors
インジケーター
NAS100
NZDUSD
XAUUSD
+14
Renko Reversal
The best filter for trading trend continuations on Renko charts.
Fibonacci Pitchfan
Powerful all-in-one tool for traders seeking a clear, dynamic view of market structure. By merging pivots, trendlines &
インジケーター
RSI
Breakout
XAUUSD
+12
Liquidity Pressure Index
Liquidity Pressure Index is a tool that gives traders deeper insights into the hidden dynamics of market liquidity
登録日 28/01/2026