
説明
MainChart_EMA_BB_PSAR
仕組み
1. コアコンセプト
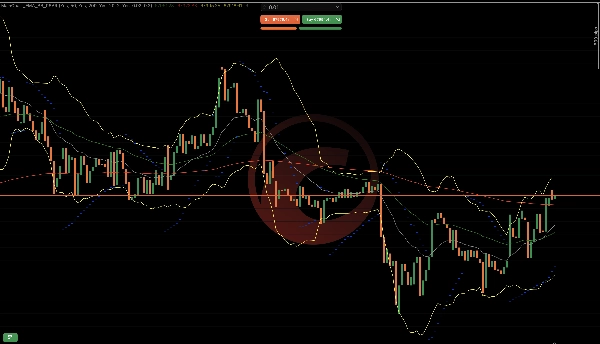
このインジケーターはトレンド、ボラティリティ、モメンタム継続のロジックを一つのオーバーレイに組み合わせています:
EMA 50 & EMA 200 → トレンド方向
ボリンジャーバンド → ボラティリティ&拡大
パラボリックSAR → トレンド継続&反転タイミング
各コンポーネントは特定の機能を果たし、共に構造化された意思決定フレームワークを形成します。
2. EMAロジック(トレンドエンジン)
機能
終値の指数移動平均を計算します。
EMA 50はより速く反応します。
EMA 200はより遅く反応します。
市場の解釈方法
条件 意味
EMA 50がEMA 200の上にある 強気トレンド
EMA 50がEMA 200の下にある 弱気トレンド
EMA 50がEMA 200をクロスする 可能なトレンドシフト
なぜ機能するのか
EMAは価格を平滑化しノイズをフィルターします。
50/200の関係は短期モメンタムと長期方向の相対を示します。
3. ボリンジャーバンドロジック(ボラティリティエンジン)
機能
移動平均(中央バンド)を計算します
標準偏差を使って上下バンドを構築します
市場の解釈方法
条件 意味
バンドが狭い 低ボラティリティ(圧縮)
バンドが広がる 高ボラティリティ(強い動き活発)
価格が外側バンドに触れる 過伸展の可能性
なぜ機能するのか
市場は圧縮と拡大を繰り返します。
ボラティリティ収縮後にブレイクアウトがよく起こります。
4. パラボリックSARロジック(継続エンジン)
機能
価格の上または下に点をプロットします。
トレンドが続くにつれて加速します。
市場の解釈方法
点の位置 意味
価格の下にある 上昇トレンドが活発
価格の上にある 下降トレンドが活発
点が反転する 反転の可能性
なぜ機能するのか
PSARはトレンドが成熟するにつれて締まり、トレイル動作や疲労検出を助けます。
5. すべてのコンポーネントの連携
強気の構造
EMA 50がEMA 200の上にある
価格がEMA 50の上にある
PSARがローソク足の下にある
ボリンジャーバンドが上向きに拡大している
→ 強い上昇モメンタムを示します
弱気の構造
EMA 50がEMA 200の下にある
価格がEMA 50の下にある
PSARがローソク足の上にある
ボリンジャーバンドが下向きに拡大している
→ 強い下降モメンタムを示します
6. 市場フェーズ検出
このインジケーターは3つの市場フェーズを識別するのに役立ちます:
トレンドフェーズ
EMAが整列している
PSARが一貫している
バンドが拡大している
継続トレードに最適です。
圧縮フェーズ
バンドが狭い
EMAがフラット
PSARが頻繁に反転している
ブレイクアウトを待つのが最適です。
トランジションフェーズ
EMAクロスが形成されている
PSARが反転している
バンドが広がっている
早期の反転の可能性があります。
7. 実践的なフロー例
強気のシーケンス例:
バンドが収縮する
強い強気ローソク足が上部バンドを突破する
EMA 50がEMA 200を上抜ける
PSARが価格の下に反転する
このシーケンスは示しています:
ボラティリティの拡大
トレンドの確認
継続のサポート
8. できないこと
ニュースを予測しません
反転を保証しません
注文フローを測定しません
偽のブレイクアウトを排除しません
確実性ではなく構造化された確認を提供します。
9. まとめのロジックモデル
トレンドフィルター → EMA
ボラティリティトリガー → ボリンジャーバンド
タイミング&トレイル → パラボリックSAR
これらが一緒になってランダムなエントリーを減らし、構造化された意思決定を向上させます。
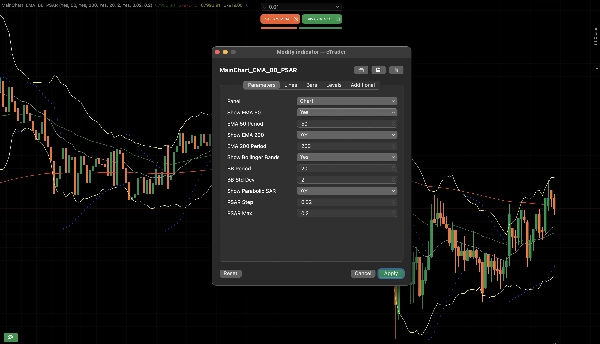
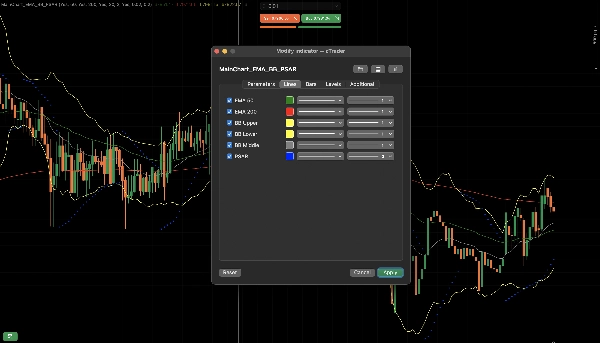
このインジケーターの良い点は設定可能で、複数のインジケーターを設定する必要がないことです。
概要
1. Exponential Moving Averages (EMA 50 and EMA 200) to determine trend direction—EMA 50 reacts faster to price changes, while EMA 200 provides a longer-term trend perspective. The relative position of these EMAs signals bullish or bearish trends and potential trend shifts.
2. Bollinger Bands to measure market volatility and detect phases of compression (low volatility) and expansion (high volatility). Narrow bands indicate potential breakout setups, while price touching outer bands suggests possible overextension.
3. Parabolic SAR to identify trend continuation and reversal timing by plotting dots above or below price, signaling active uptrends or downtrends and potential reversals when dots flip position.
Together, these components form a structured decision framework that helps identify market phases—trending, compression, and transition—and supports confirmation of trend strength and momentum. The indicator is configurable and designed to reduce random entries by combining trend filtering, volatility triggers, and timing signals. It is applicable across various markets including Forex, cryptocurrencies, stocks, commodities, and indices. This tool provides structured confirmation for trading decisions but does not predict news events, guarantee reversals, or eliminate false breakouts.
カスタマーレビュー
5 | 50 % | |
4 | 50 % | |
3 | 0 % | |
2 | 0 % | |
1 | 0 % |


