
説明
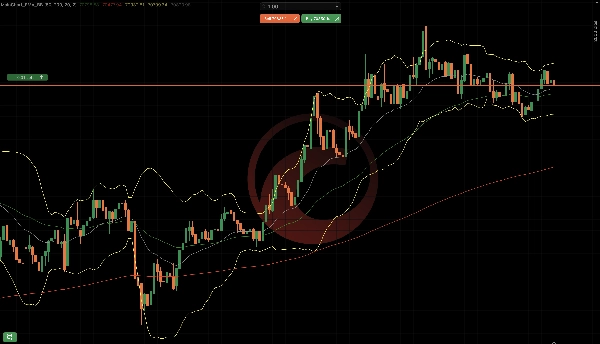
MainChart_EMA_BB はcTrader用の メインチャートオーバーレイインジケーター で、以下を組み合わせています:
- 指数移動平均線(EMA 50 & EMA 200)
- ボリンジャーバンド(上部 / 中央 / 下部)
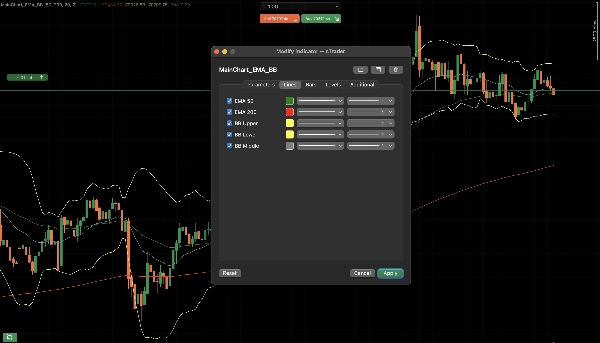
インジケーターの構成要素
指数移動平均線(EMA)
2つのEMAが利用可能です:
EMAデフォルト期間デフォルトカラー
EMA 50
50
緑
EMA 200
200
赤
目的:
- トレンドの方向
- 動的なサポート/レジスタンス
- EMA 50がEMA 200の上にある → 強気バイアス
- EMA 50がEMA 200の下にある → 弱気バイアス
ボリンジャーバンド
ボリンジャーバンドは以下で構成されます:
- 上部バンド
- 中央バンド(EMAベース)
- 下部バンド
デフォルト設定:
- 期間:20
- 標準偏差:2.0
- 移動平均タイプ:指数移動平均
目的:
- ボラティリティの測定
- 買われ過ぎ / 売られ過ぎゾーン
- 価格が上部バンドに触れる → 潜在的な疲弊
- 価格が下部バンドに触れる → 潜在的な反発
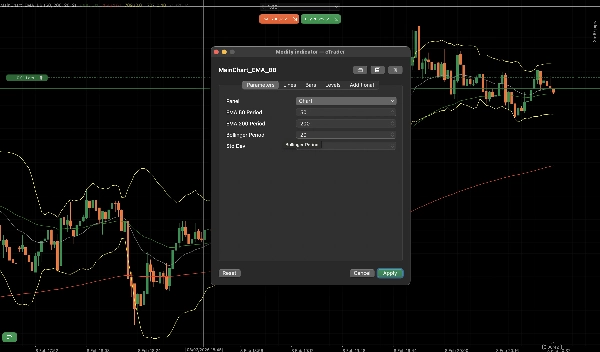
パラメーターの説明
EMAパラメーター
- EMA 50を表示: EMA 50の有効/無効
- EMA 50期間: 計算期間
- EMA 200を表示: EMA 200の有効/無効
- EMA 200期間: 計算期間
ボリンジャーバンドのパラメーター
- ボリンジャーバンドを表示: BBの有効/無効
- BB期間: 遡及期間
- BB標準偏差: ボラティリティ乗数
典型的な取引での使用法
トレンドの確認
- EMA 50がEMA 200の上にある
- ロングトレードのみを優先
反転 / プルバック
- 価格がEMA 50にプルバックする
- ボリンジャーバンドのスクイーズ後の拡大
このインジケーターの良い点は設定可能であり、複数のインジケーターを設定する必要がないことです。
概要
インジケーターのプロフィール
カスタマーレビュー
4.5
レビュー: 2
5 | 50 % | |
4 | 50 % | |
3 | 0 % | |
2 | 0 % | |
1 | 0 % |
カスタマーレビュー
February 16, 2026
a 1R exit plan makes review easier, and messy areas become easier to avoid.
February 15, 2026
ディスカッション
よくあるご質問
Prop
Forex
Indices
Commodities
Crypto
Stocks
Bollinger
cTrader Storeで入手可能な取引ボット、インジケーター、プラグインなどの商品は、第三者の開発者が提供するものであり、情報と技術の取得のみを目的としてご利用いただけます。cTrader Storeはブローカーではなく、投資助言や個人的な推奨を行うことも、将来のパフォーマンスを保証することもありません。
この作成者の他の商品


価格
登録日 01/04/2025