
Dominator M4tr1x
これは、チャート上のスマートマネーの価格構造分析と複数の情報ダッシュボードパネルを組み合わせた基本的な情報ツールです。主要なシステムの内訳は以下の通りです:
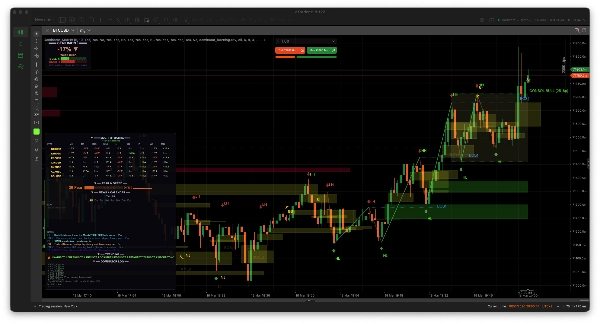
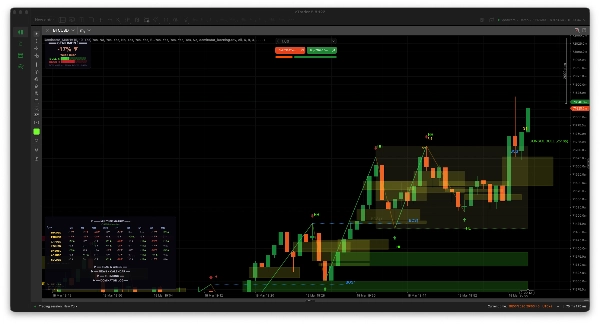
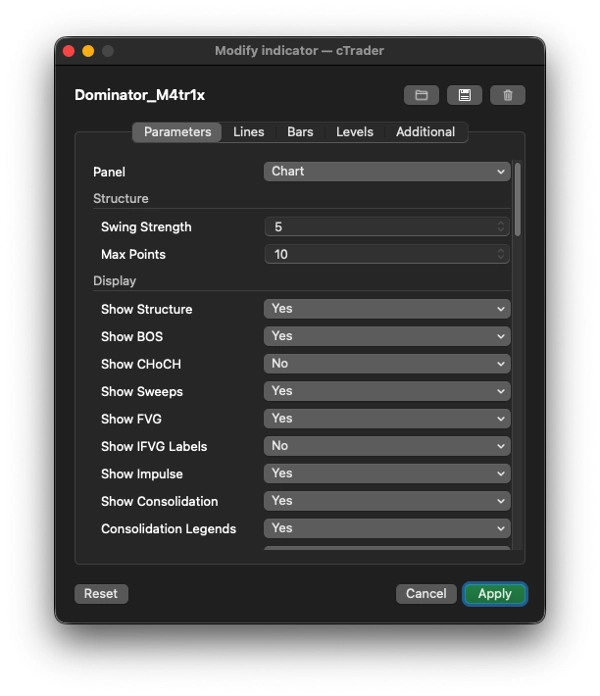
1. 📊 チャート上:スマートマネー構造分析
価格チャートに直接描画します:
機能
その機能;
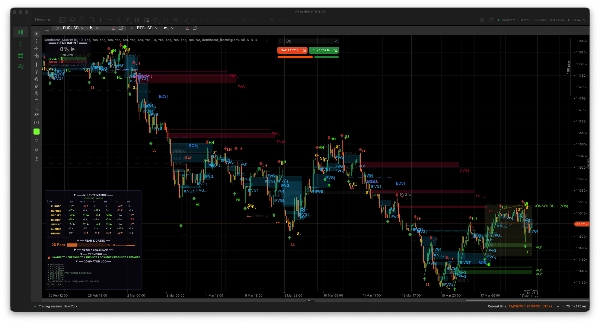
スイング検出
設定可能な遡及強度を使用してスイングの高値/安値を識別し、矢印(▲/▼)でマークします
構造ラベル
各スイングにHH(ハイアーハイ)、HL(ハイアーロー)、LH(ローワーハイ)、LL(ローワーロー)のラベルを付けて市場構造をマッピングします
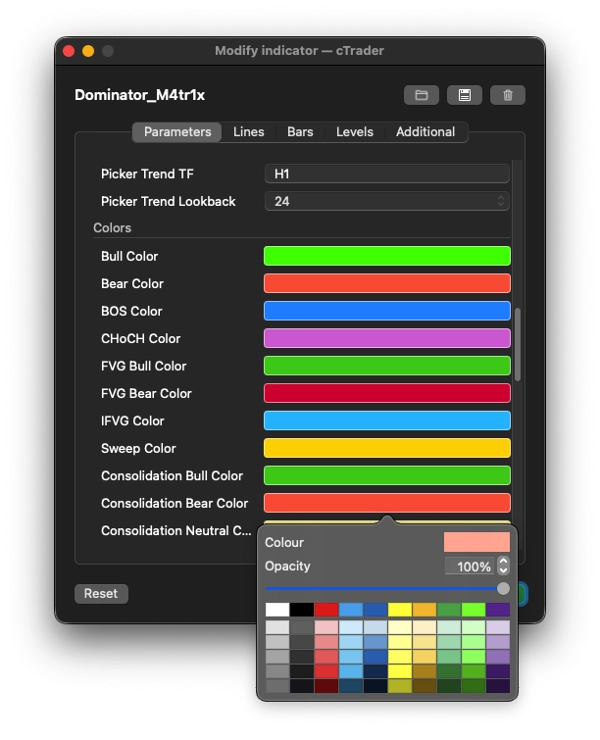
BOS(構造の破壊)
価格が前のスイングの高値/安値を トレンド方向に突破したときに点線とラベルを描画します
CHoCH(キャラクターの変化)
BOSと同様ですが、トレンドに逆らって— 潜在的なトレンド反転を示します
ブレイク無効化
価格がBOS/CHoCHレベルを逆戻りした場合、それを失敗(✗でグレー表示)としてマークし、記録します
流動性スイープ
価格がスイングの高値を上回る(または安値を下回る)が、再び内部で終値をつける場合を検出します — 典型的な流動性獲得パターンです
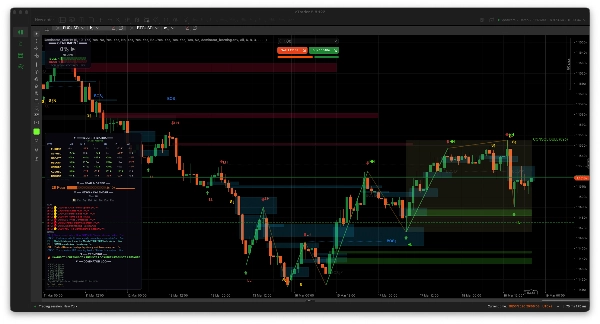
FVG(公正価値ギャップ)
3本のローソク足の不均衡(ローソク足1の高値とローソク足3の安値の間のギャップ)を検出し、チャートに色付きの矩形を描画します
IFVG(逆FVG)
価格がFVGを埋めに戻ると、それを「IFVG」とラベル付けします(ギャップが潜在的なサポート/レジスタンスゾーンになります)
FVG無効化
価格がFVGゾーンを決定的に突破して終値をつけた場合、それは無効とマークされます
インパルス波
スイングポイントをトレンドラインで結びます — インパルスレッグ(トレンド方向)は緑色、修正レッグは黄色
統合ゾーン
連続するスイング高値と安値が狭いATRベースの範囲内にある場合を検出し、「CONSOL BULL/BEAR/NEUTRAL」ラベル付きのボックスを描画し、方向バイアスとピップ幅を表示します
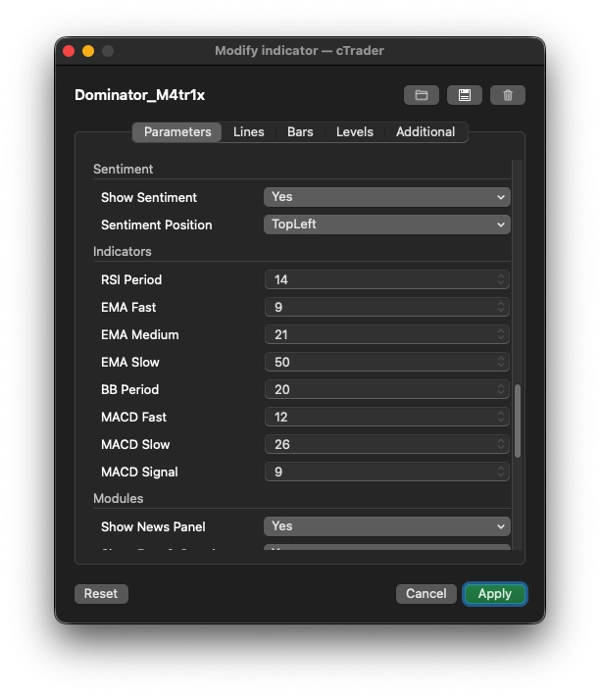
2. 📈 センチメントパネル(デフォルトは左上)
現在のチャートのシンボル/時間枠に対するリアルタイムの強気/弱気スコアゲージを以下を使って表示します:
- RSI(売られ過ぎ/買われ過ぎ+ダイバージェンス検出)
- MACD(クロスオーバー、ヒストグラムのモメンタム)
- 3つのEMA(速い/中間/遅いの整列と価格の位置)
- ボリンジャーバンド(価格が上部/下部バンドの極端にあるか)
表示内容:
- -100%から+100%までのパーセンテージスコア(例:「+67% 強い強気」)
- 視覚的な強気対弱気のポイントバー(█████░░░░)
- 実行中のシグナル統計(総シグナル数、確認済み、無効化、精度%)
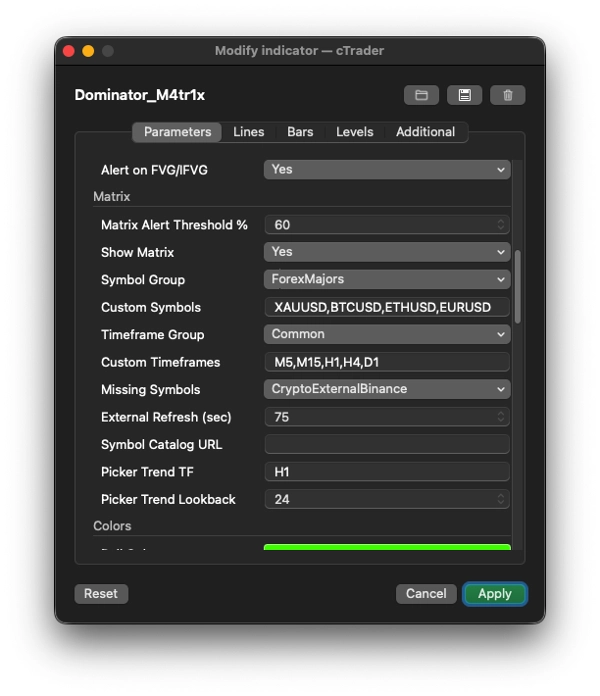
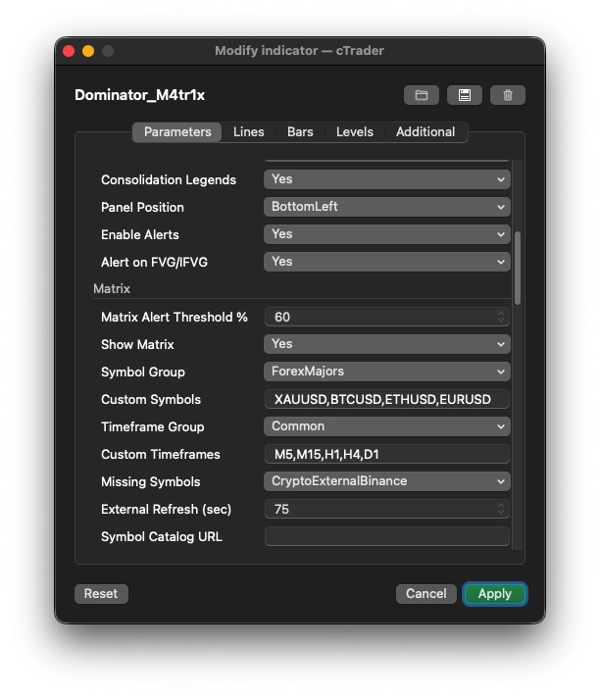
3. 🔢 マルチタイムフレームマトリックス(メインパネル)
複数のシンボル×複数の時間枠にわたる強気/弱気センチメントスコアを同時に示すグリッド/ヒートマップです。
側面
詳細
シンボルグループ
Forexメジャー/マイナー/エキゾチック、暗号通貨、指数、米国株、金属、エネルギー、商品、またはカスタム
時間枠グループ
一般的なもの(M5–W1)、すべて、またはカスタム
各セル
「+42▲」(緑)や「-67▼」(赤)のような色分けされたスコアを、同じRSI/MACD/EMA/BBスコアリングエンジンを使って表示します
シンボル解決
非常に堅牢で、ブローカーの命名規則(.r、m、.cashのようなサフィックスや、EUR/USDのようなスラッシュ)を自動検出し、数十のエイリアスの組み合わせを試し、結果をキャッシュします
外部データ
ブローカーが取り扱っていないシンボル(特に暗号通貨)については、Binance、Bybit、OKX、Kraken、BitfinexのAPIからOHLCデータを取得します(無料、キー不要)
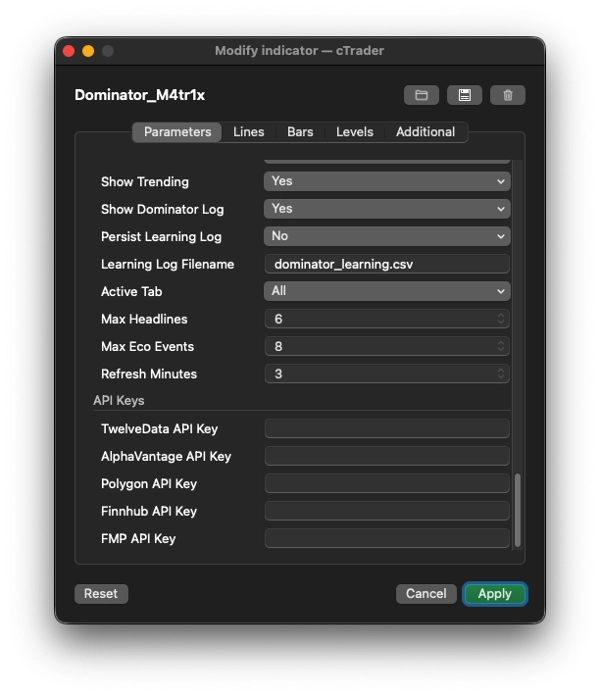
プレミアムAPI
オプションでTwelveData、AlphaVantage、Polygon、StooqをAPIキー経由で株式/指数/為替に対応
インタラクティブ
任意のシンボル名をクリックすると、100以上のシンボルをカテゴリ別に検索可能なシンボルピッカーが開き、24時間の%変化を表示します。任意の時間枠ヘッダーをクリックすると、列を入れ替える時間枠ピッカーが開きます
アラート
任意のセルが設定可能な閾値(例:±60%)を超えると、アラート音を鳴らします
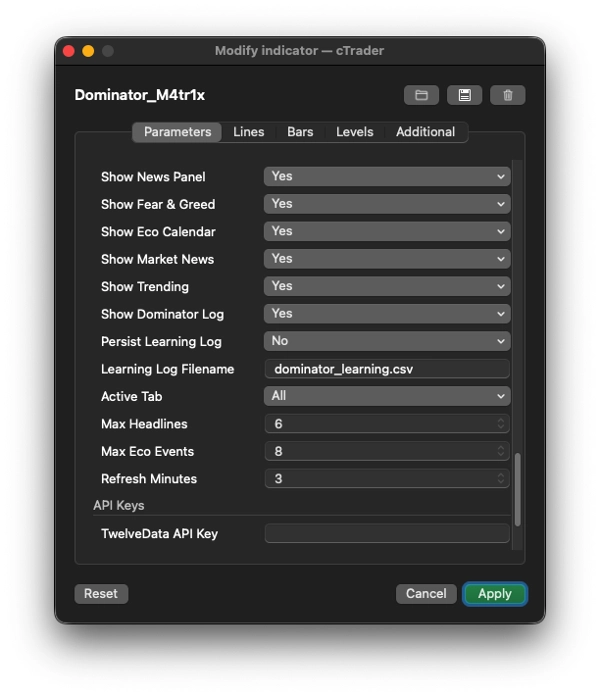
4. 📰 ニュース+情報パネル
経済カレンダー
以下の8以上の冗長なソースから今後の高/中影響の経済イベントを集約します:
- ForexFactory(JSON+XML)、TradingView、Finnhub、TradingEconomics、MQL5、FXStreet、FMP(FinancialModelingPrep)
- 緊急度による色分け(赤=今、オレンジ=15分未満、黄=1時間未満、緑=後)
マーケットニュースヘッドライン
以下の12以上のRSS/APIソースから集約します:
- 暗号通貨:CryptoCompare、CoinDesk、CoinTelegraph、NewsBTC、Binanceアナウンスメント、OKXシステムステータス
- 為替:FXStreet、ForexLive
- 指数/株式:MarketWatch、CNBC、Reuters、Yahoo Finance
- キーワード検出によるヘッドラインの自動分類(暗号/為替/金属/エネルギー/株式)
- タブ(すべて、為替、暗号、金属、指数、株式、エネルギー、経済)でフィルタ可能
恐怖と強欲指数
- Crypto Fear & Greed Indexを取得(alternative.me API、CNN Businessフォールバック付き)
- 数値(0–100)、ラベル(極度の恐怖→極度の強欲)、カラーバー、および7日間のスパークライン履歴(▁▂▃▄▅▆▇█)を表示
トレンド
- Binanceの24時間ティッカーからトップ暗号通貨の動き(トップ5の上昇銘柄+トップ5の下落銘柄)を取得
- CoinGeckoトレンドまたはCoinPaprikaにフォールバック
5. 📝 DOMINATORログ+学習システム
- 最後の8つのシグナルとステータス(●アクティブ、✓確認済み、✗無効化)を表示するシグナルログを保持
- 全体の精度統計(総シグナル数、確認済みフィル、無効化、精度%)を追跡
- オプションのCSV永続化:すべてのシグナルイベント(新規/確認/無効)をCSVファイル(
dominator_learning.csv)にフルメタデータ付きで書き込み、将来の機械学習やバックテストに対応
6. 🛠 技術的アーキテクチャのハイライト
- 完全オーバーレイ(
IsOverlay = true)— 価格チャート上に描画し、別パネルではありません - AccessRights = None — ブローカーのサンドボックス内で実行(cAlgoが許可する範囲を超えたファイルシステム/ネットワークアクセスなし)
- 非同期データ取得 — すべてのHTTP呼び出しは
Task.Run()を介してバックグラウンドスレッドで実行され、チャートをブロックしません - インテリジェントキャッシュ — シンボル解決、外部OHLCデータ、ティッカープライス、トレンドパーセンテージはすべて設定可能な更新間隔でキャッシュされます
- 自動再試行 — 失敗したシンボル解決や外部データ取得は45秒ごとに再試行されます
- 折りたたみ可能なセクション — 各パネルセクション(マトリックス、恐怖と強欲、ニュース、トレンド、ログ)はヘッダーをクリックして折りたたみ/展開可能です
まとめ
Dominator M4tr1xは、トレーディングダッシュボード全体を置き換える情報指標です。チャート上にスマートマネー構造(BOS、CHoCH、FVG、スイープ、統合)をマッピングし、テクニカル指標を通じてマルチアセット/マルチタイムフレームのセンチメントをスコアリングし、20以上のソースから経済カレンダーとマーケットニュースを集約し、恐怖と強欲を追跡し、トレンド資産を表示し、すべてのシグナルを精度追跡付きでログに記録し、シンボルと時間枠をインタラクティブに切り替え可能にします — さらに、5以上の外部取引所APIから不足データをバックグラウンドで取得します。
5 | 0 % | |
4 | 100 % | |
3 | 0 % | |
2 | 0 % | |
1 | 0 % |


