
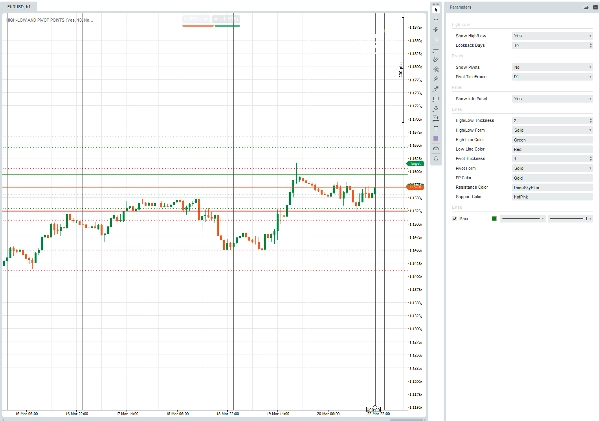
PIVOT POINTS, HIGH-LOW OF THE DAY
Indicador
108 transferências
Versão 1.0, Mar 2026
Windows, Mac
Descrição
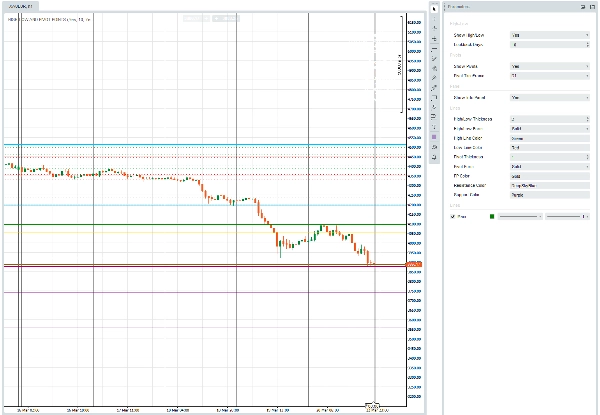
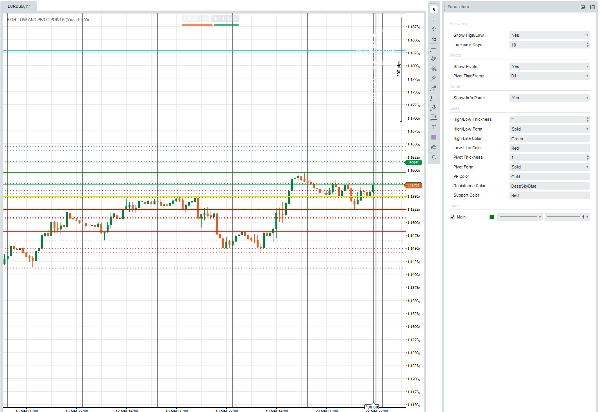
HIGH-LOW E PONTOS DE PIVÔ é um indicador sobreposto do cTrader que plota os níveis diários de preço máximo/mínimo e os pontos de pivô clássicos diretamente no seu gráfico.
Parâmetros em resumo:
GrupoO que você controla
Máximo-Mínimo
Mostrar/ocultar linhas; quantos dias passados exibir (Dias de Retrospectiva)
Pivôs
Mostrar/ocultar linhas; qual período determina o cálculo do pivô (Diário, Semanal, etc.)
Painel
Mostrar/ocultar a caixa de informações no gráfico listando preços atuais e níveis de pivô
Linhas
Espessura, estilo (Sólido / Pontilhado / Muito Pontilhado) e cor para as linhas de Máximo, Mínimo, PP, Resistência e Suporte
O que ele desenha:
- Máximo/Mínimo do dia nas cores escolhidas; dias anteriores de retrospectiva em uma versão mais clara/fina das mesmas.
- Sete níveis padrão de pivô — PP, R1–R3, S1–S3 — calculados a partir da barra anterior completa do período de pivô selecionado.
- Um painel de informações no canto superior direito resumindo o Máximo/Mínimo do dia ao vivo, o intervalo de retrospectiva de vários dias e todos os sete preços de pivô.
Resumo
Resumo de IA
The "Pivot Points, High-Low of the Day" indicator for cTrader overlays daily high and low price levels along with classic pivot points directly on trading charts. It visually displays today's high and low prices, as well as those from prior days based on a configurable lookback period. The indicator calculates and plots seven standard pivot levels—Pivot Point (PP), Resistance levels R1 to R3, and Support levels S1 to S3—derived from the previous completed bar of a selectable timeframe (e.g., daily or weekly). Users can customize visibility, line thickness, style (solid, dotted, very dotted), and colors for all lines including high, low, pivot, resistance, and support. An optional on-chart info panel summarizes live day high/low, multi-day range, and all pivot prices for quick reference. This tool supports multiple markets and symbols including Forex pairs (EURUSD, GBPUSD, NZDUSD, USDJPY), cryptocurrencies (BTCUSD), commodities (XAUUSD), indices (NAS100), and stocks. It is designed to assist traders in identifying key price levels and potential breakout or reversal points based on historical price data and pivot calculations.
Perfil do indicador
Avaliações de clientes
0.0
Avaliações: 0
Avaliações de clientes
Ainda não há avaliações para este produto. Já o experimentou? Seja o primeiro a contar a outras pessoas!
Conversa
Perguntas frequentes
BTCUSD
Forex
Breakout
Indices
EURUSD
Commodities
GBPUSD
NZDUSD
Crypto
Stocks
XAUUSD
NAS100
USDJPY
Os produtos disponíveis através da cTrader Store, incluindo bots de negociação, indicadores e plugins, são fornecidos por programadores terceiros e são disponibilizados apenas para fins informativos e de acesso técnico. A cTrader Store não é um corretor e não fornece aconselhamento em matéria de investimento, recomendações pessoais ou qualquer garantia de desempenho no futuro.
Mais deste autor


![Logótipo de "[Stellar Strategies] Smart ADX"](https://cdn.ctrader.com/image/webp/af13b084-b6f6-41db-b7bc-c7e688b57b05_36929)


Preço
49
Vendas
306
Instalações gratuitas