説明
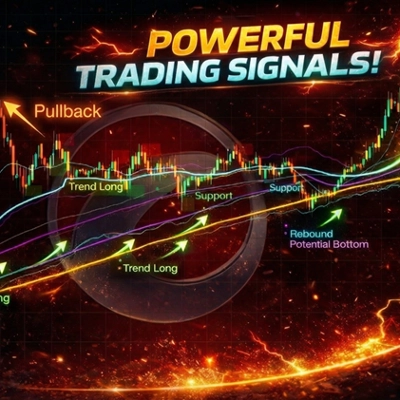
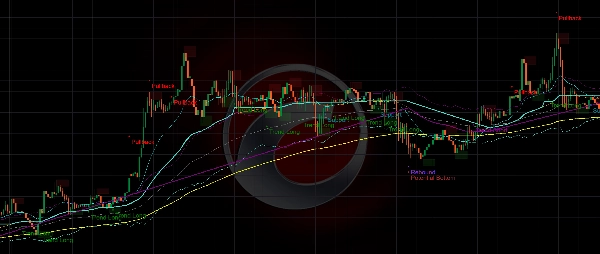
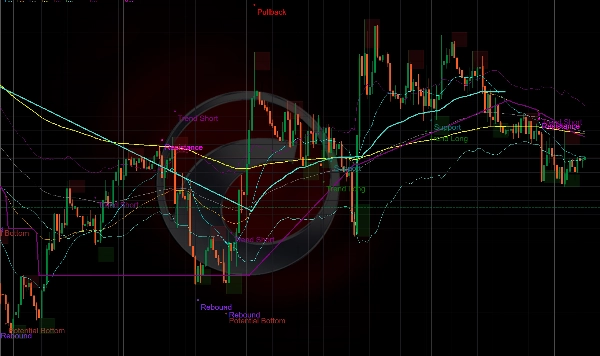
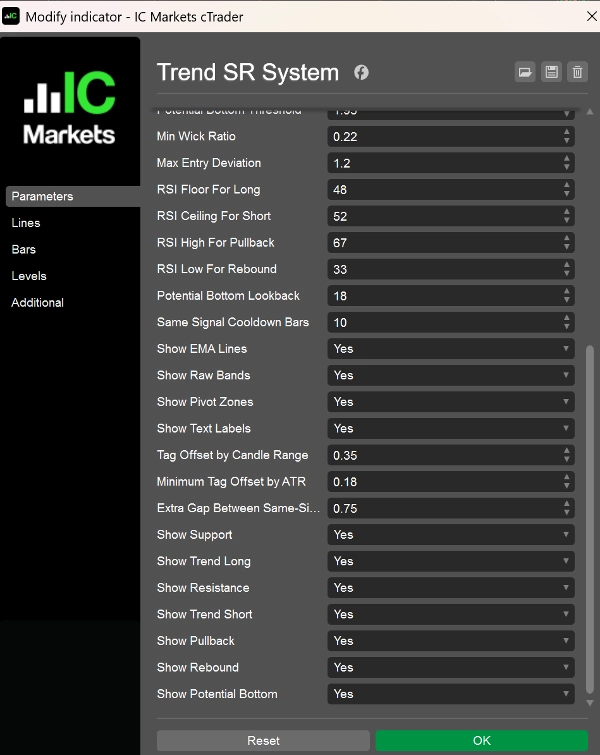
Trend SRシステムは、トレーダーが市場のコンテキスト、主要なEMA構造、動的なサポート/レジスタンスレベル、および潜在的な継続または短期的な平均回帰ゾーンをより明確に識別するのを支援するために設計されたトレンド指向のチャートインジケーターです。
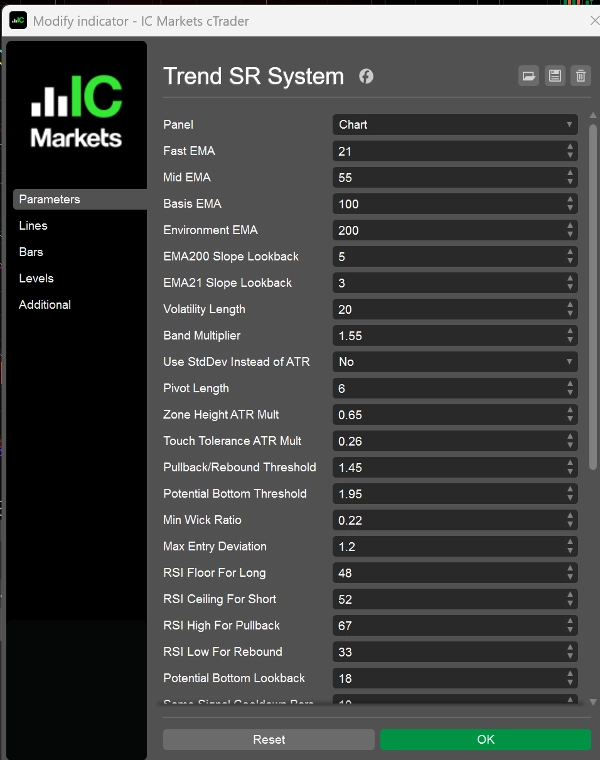
このインジケーターはEMA21、EMA55、EMA100、およびEMA200を中心に構築されています:
- EMA200はより高レベルの市場環境フィルターとして使用されます
- EMA100は中央の価格軸およびバンドの基準線として機能します
- EMA55は中期のサポートおよびレジスタンス圧力の識別に役立ちます
- EMA21は短期のリズム、プルバック、およびリトレースメントの追跡に使用されます
さらに、このインジケーターはボラティリティバンド、ピボットベースの構造ゾーン、およびステップスタイルの動的サポート/レジスタンスロジックを組み合わせて、市場のより構造化されたビューを提供します。
主な特徴
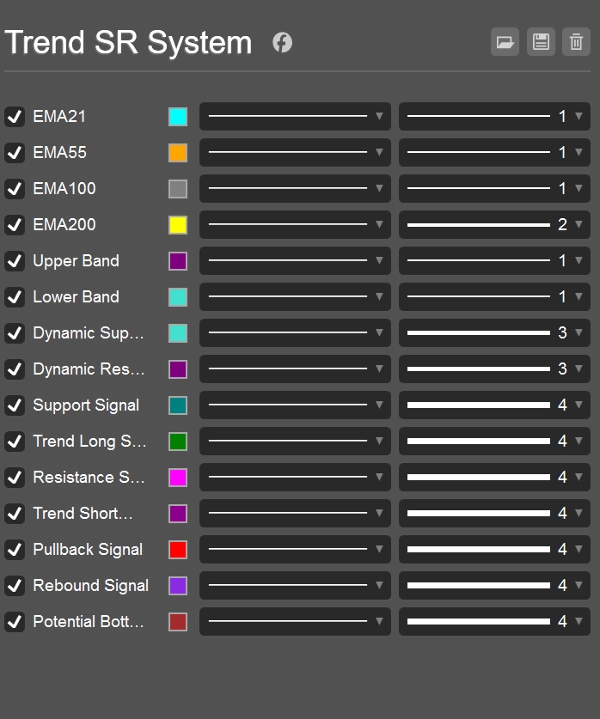
- 4つの主要なEMA構造ラインを表示
- ATRまたは標準偏差に基づく上下のバンドを表示
- 動的なサポートおよび動的なレジスタンスレベルを生成
- ピボットロジックを使用して構造的なサポート/レジスタンスエリアを検出
- 継続タイプおよび短期修正タイプのシグナルを提供
- 個別のシグナルタイプをオンまたはオフに切り替え可能
シグナルタイプ
- サポート
強気環境における重要なサポートエリアで、プルバック後に価格が守られていることを示唆します。 - トレンドロング
強気市場におけるトレンドフォローのロングシグナルで、通常プルバック後に上昇モメンタムが再開する際に現れます。 - レジスタンス
弱気環境における重要なレジスタンスエリアで、リトレースメント後に価格が抑えられていることを示唆します。 - トレンドショート
弱気市場におけるトレンドフォローのショートシグナルで、通常リバウンドの勢いが失われ、下落トレンドが再開する際に現れます。 - プルバック
強気環境における短期の過剰伸長警告で、プルバックまたは調整のリスクを示唆します。 - リバウンド
弱気環境における短期の売られ過ぎ警告で、技術的なリバウンドのリスクを示唆します。 - 潜在的なボトム
より強い売られ過ぎ回復タイプのシグナルで、一時的な底形成の試みの可能性を強調します。
典型的な使用例
このインジケーターは以下に適しています:
- トレンドフォロー分析
- プルバックおよびリトレースメントのエントリータイミング
- EMA構造およびサポート/レジスタンスの観察
- 過剰伸長した強気または弱気の状態の監視
- チャートベースのトレードフィルタリングおよび裁量的意思決定支援
外国為替、指数、金属、暗号通貨、その他のトレンド市場で使用可能です。
最適な対象
このインジケーターは以下のトレーダー向けに設計されています:
- より明確で構造化されたチャートビューを望む方
- トレンドの継続および重要な反応ゾーンに注目する方
- EMA構造を価格の動きやサポート/レジスタンスと組み合わせて使用する方
- 短期から中期のセットアップに視覚的なトレーディング支援を好む方
使用上の注意
- 市場のコンテキストおよび適切なリスク管理と併用するのが最適です
- シグナルは単独の取引アドバイスとして扱うべきではありません
- 乱高下や低ボラティリティの市場状況ではシグナルの質が低下する可能性があります
- これはチャート分析および取引支援ツールとして意図されており、保証されたパフォーマンスシステムではありません
概要
インジケーターのプロフィール
インジケーターのカテゴリー
トレンド
出力の種類
シグナル
データ要件
バーのみ
サポート対象のシグナル
反転
ブレイクアウト
トレンドの強さ
カスタマーレビュー
4.0
レビュー: 1
5 | 0 % | |
4 | 100 % | |
3 | 0 % | |
2 | 0 % | |
1 | 0 % |
ディスカッション
よくあるご質問
Prop
Forex
Signal
Indices
Supertrend
Commodities
RSI
Crypto
Stocks
ATR
cTrader Storeで入手可能な取引ボット、インジケーター、プラグインなどの商品は、第三者の開発者が提供するものであり、情報と技術の取得のみを目的としてご利用いただけます。cTrader Storeはブローカーではなく、投資助言や個人的な推奨を行うことも、将来のパフォーマンスを保証することもありません。
この作成者の他の商品


価格
登録日 25/03/2026