

Cutrim Theory
지표
213 다운로드
버전 1.4, Jun 2026
Windows, Mac

가입일 31/03/2025
547.49M
거래량
887.44K
핍 수익
213
무료 설치
설명
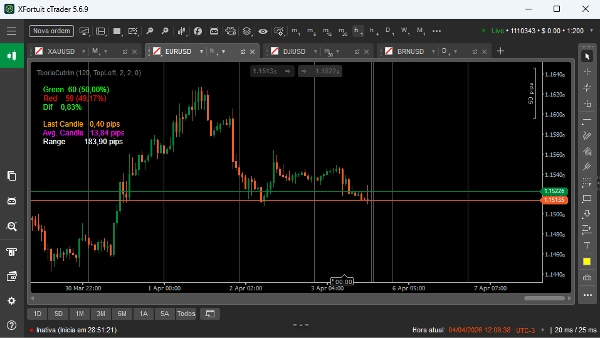
TeoriaCutrim 은 캔들 분포와 변동성 분석을 통해 최근 시장 행동을 정량화하도록 설계된 통계적 오버레이 지표입니다. 방향을 예측하는 대신, 구성 가능한 캔들 창 내에서 시장이 방금 수행한 것에 대한 객관적인 데이터를 제공합니다.
분석된 시장 데이터
이 지표는 사용자가 정의한 최근 캔들 수(되돌아보기 기간)를 평가하고 다음을 추출합니다:
- 강세 캔들 수 및 비율(종가 > 시가)
- 약세 캔들 수 및 비율(종가 < 시가)
- 강세와 약세 우위 간의 차이
- 평균 캔들 범위(핍 단위)
- 현재 캔들 범위(핍 단위)
- 분석된 창 전체의 총 가격 범위
시각적 출력 및 해석
이 지표는 차트에 주요 지표를 직접 표시합니다:
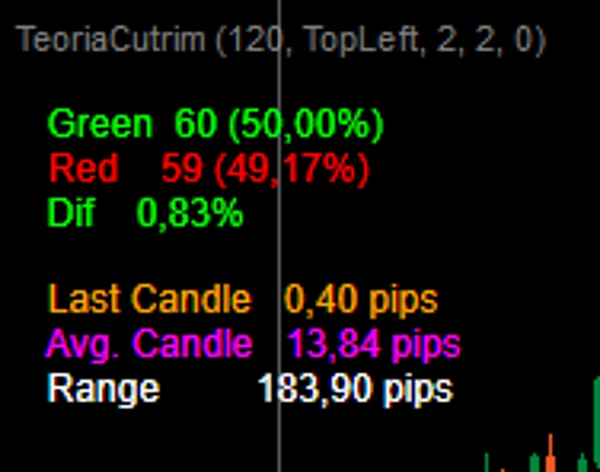
- 녹색: 총 강세 캔들 수 및 비율
- 빨간색: 총 약세 캔들 수 및 비율
- 차이: 강세와 약세 비율 간의 절대 차이
- 마지막 캔들: 현재 캔들 크기(핍 단위)
- 평균 캔들: 선택된 창 내 캔들의 평균 크기
- 범위: 창 내 최고가와 최저가 간 거리
해석은 간단합니다:
- 강세 캔들 수가 많을수록 최근 상승 압력을 시사합니다
- 약세 캔들 수가 많을수록 최근 하락 압력을 시사합니다
- 낮은 차이(Dif)는 균형 또는 무작위성을 나타냅니다
- 평균 캔들 크기 증가 시 변동성 확대를 나타냅니다
- 큰 총 범위는 시장 확장을, 작은 범위는 압축을 시사합니다
주요 매개변수
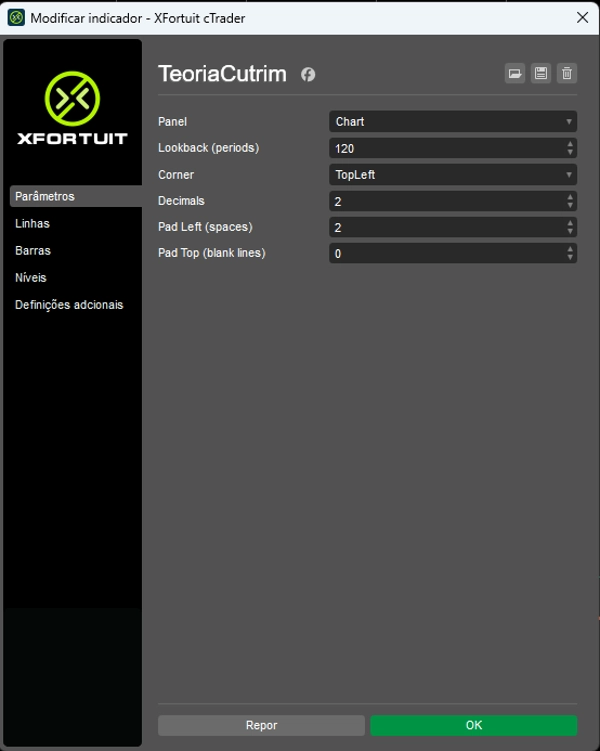
- 되돌아보기: 분석에 사용되는 캔들 수(완전 조정 가능)
- 모서리: 데이터 표시의 화면 위치
- 소수점: 표시할 소수 자릿수
- 왼쪽 여백 / 위쪽 여백: 시각적 간격 조정
사용 사례
TeoriaCutrim은 신호 생성기가 아니라 상황 도구로 가장 잘 사용됩니다. 일반적인 적용 예는 다음과 같습니다:
- 거래 진입 전 통계적 불균형 측정
- 변동성 확대 또는 축소 식별
- 최근 캔들 행동을 기반으로 한 거래 필터링
- 정량적 또는 확률 기반 전략 지원
대상 사용자
이 지표는 주관적 패턴 인식보다는 데이터, 통계 및 객관적 분석에 의존하는 트레이더를 위해 설계되었습니다. 재량적 트레이더와 체계적 트레이더 모두에게 적합합니다.
요약
AI 요약
Cutrim Theory is a statistical overlay indicator that analyzes recent market behavior by examining a user-defined number of candles. It quantifies candle dominance, difference, and volatility in pips without predicting market direction. The indicator calculates and displays on the chart: the number and percentage of bullish and bearish candles, the absolute difference between bullish and bearish dominance, the current candle size, the average candle size, and the total price range within the selected window. These metrics help traders assess recent upward or downward pressure, market balance, and volatility expansion or contraction. Adjustable parameters include the lookback period, display position, decimal precision, and visual spacing. Designed for traders who prefer data-driven, objective analysis, Cutrim Theory serves as a context tool to measure statistical imbalances, identify volatility changes, filter trades based on candle behavior, and support quantitative or probability-based strategies. It is applicable to Forex markets, including EURUSD.
지표 프로필
상담
고객 리뷰
0.0
리뷰: 0
고객 리뷰
이 상품에 대한 리뷰가 아직 없습니다. 이미 사용해 보셨나요? 다른 사람들에게 가장 먼저 소개해 주세요!
자주 묻는 질문(FAQ)
Forex
EURUSD
트레이딩 봇, 지표, 플러그인 등 cTrader Store에서 제공되는 상품은 제3자 개발자에 의해 제공되며, 이는 단순히 정보 및 기술적 접근을 목적으로 제공된 것입니다. cTrader Store는 중개인이 아니며, 투자 조언, 개인별 추천 또는 향후 성과에 대한 어떠한 보장도 제공하지 않습니다.








!["[Stellar Strategies] Market Regime Filter" 로고](https://cdn.ctrader.com/image/webp/3bdeba11-7e8b-4e5f-9af9-d562f48df039_28423)








가격
가입일 31/03/2025
547.49M
거래량
887.44K
핍 수익
213
무료 설치