
説明
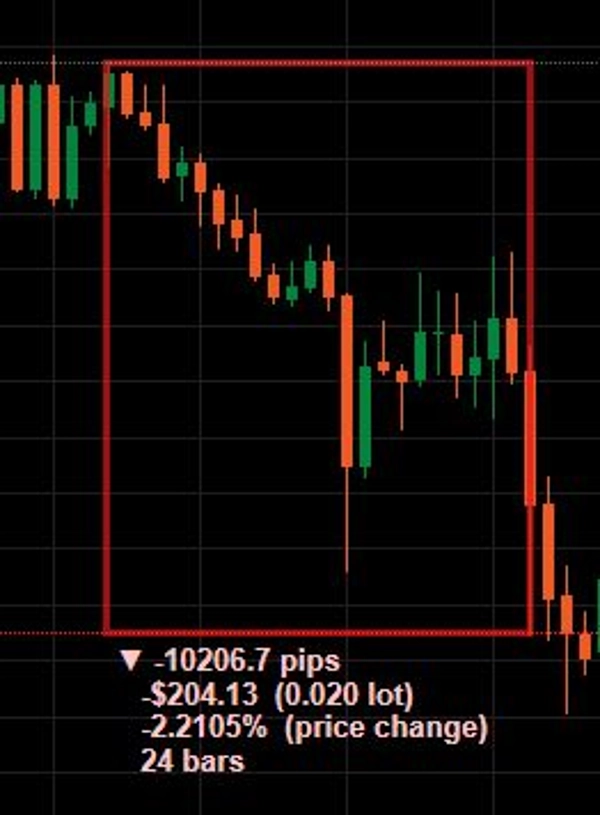
PriceMeasure は、トレーダーがチャート上で価格の動きを迅速かつ正確に測定できるように設計されたcTrader向けの高度な測定プラグインです。
このツールはTradingViewの「定規」機能と似ていますが、追加機能が含まれています。
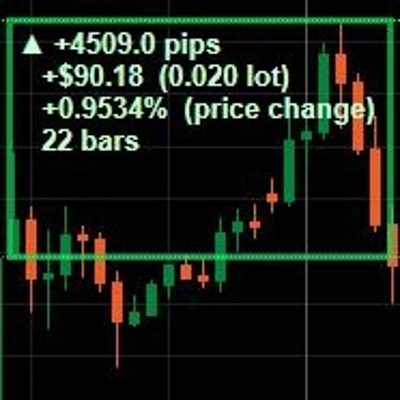
チャート上で2点を選択すると、ツールは自動的に以下を計算します:
- 価格の距離、
- ピップの距離、
- 価格変動の割合、
- 測定ポイント間のローソク足の数。
プラグインはユーザーがカスタムのロットサイズを定義できるようにし、自動的に以下を計算します:
- 潜在的な利益、
- 潜在的な損失、
- USDでの動きの価値。
これにより、以下が大幅にスピードアップします:
- リスク/リワード分析、
- ポジションサイズ設定、
- リスク管理。
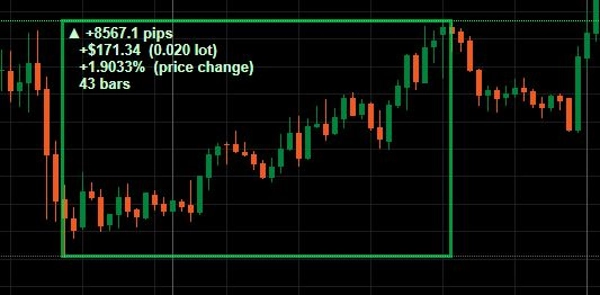
プラグインは強気の動き(緑の長方形)と弱気の動き(赤の長方形)を自動的に区別します。
プラグインの使い方
1. ツールを有効にする
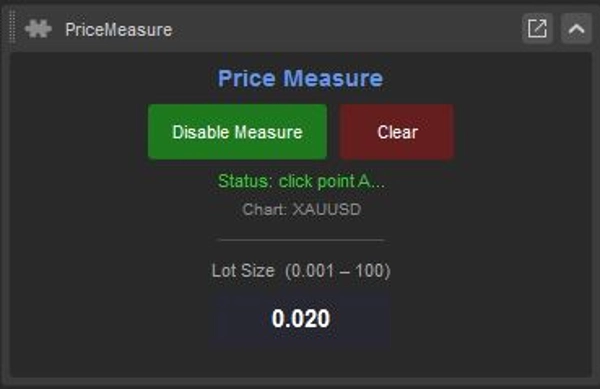
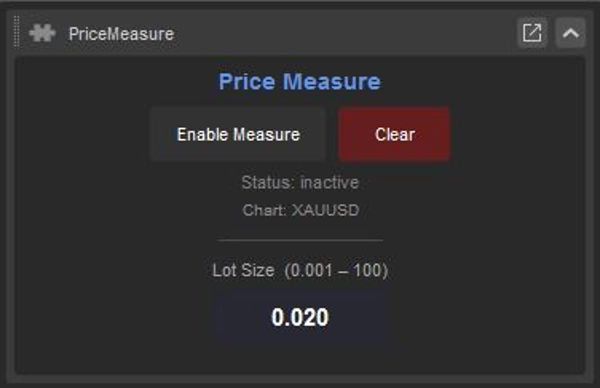
クリック: Enable Measure
2. ポイントAを選択
チャート上の最初の価格レベルをクリックします。これが測定の開始点になります。
3. ポイントBを選択
2番目の価格レベルをクリックします。プラグインは自動的に測定エリアを描画し、すべての統計を表示し、値を計算します。
4. データを確認
チャートには以下が表示されます:
- ピップ数、
- USD価値、
- 変動率、
- ローソク足の数。
5. 複数の測定を作成
各測定は手動で削除するまでチャート上に残ります。
6. 測定をクリア
クリック:Clear
でチャート上のすべての測定を削除します。
ロットサイズ
利益/損失計算に使用されるポジションサイズを定義します。
概要
AIによる概要
PriceMeasure is a measurement plugin for the cTrader platform that enables traders to quickly and accurately measure price movements on charts. Functioning similarly to TradingView’s “Ruler” tool but with enhanced capabilities, it allows users to select two points on a chart to automatically calculate key metrics including price distance, pip distance, percentage price change, and the number of candles between points.
Users can define a custom Lot size to enable automatic calculations of potential profit, potential loss, and movement value in USD. The plugin visually distinguishes bullish movements with green rectangles and bearish movements with red rectangles, aiding in quick interpretation.
Key features include support for multiple simultaneous measurements on the chart, which remain until manually cleared, and a streamlined workflow for risk/reward analysis, position sizing, and risk management. The plugin displays pip count, USD value, percentage change, and candle count for each measurement, facilitating detailed trade planning and analysis directly within the cTrader chart interface.
Users can define a custom Lot size to enable automatic calculations of potential profit, potential loss, and movement value in USD. The plugin visually distinguishes bullish movements with green rectangles and bearish movements with red rectangles, aiding in quick interpretation.
Key features include support for multiple simultaneous measurements on the chart, which remain until manually cleared, and a streamlined workflow for risk/reward analysis, position sizing, and risk management. The plugin displays pip count, USD value, percentage change, and candle count for each measurement, facilitating detailed trade planning and analysis directly within the cTrader chart interface.
プラグインのプロフィール
プラグインのカテゴリー
取引管理
データアクセス
チャート
カスタマーレビュー
0.0
レビュー: 0
カスタマーレビュー
この商品にはまだレビューがありません。お使いになったことがある方は、ぜひレビューをお願いします。
ディスカッション
よくあるご質問
Position Sizer
Chart UI Tools
Risk/Reward
SL/TP Templates
Risk Calculator
cTrader Storeで入手可能な取引ボット、インジケーター、プラグインなどの商品は、第三者の開発者が提供するものであり、情報と技術の取得のみを目的としてご利用いただけます。cTrader Storeはブローカーではなく、投資助言や個人的な推奨を行うことも、将来のパフォーマンスを保証することもありません。


価格
登録日 03/06/2025