present
新規登録で初回購入時に$50オフ
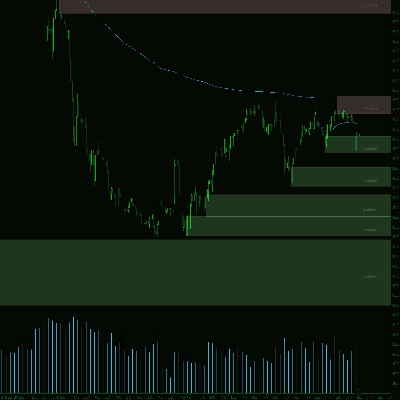
Trading product for Hurst Cycle Panel インジケーター Key Levels Market Structure, image 1
Hurst Cycle Panel
インジケーター
バージョン 1.0、Jun 2026
Windows、Mac
Trading product for Hurst Cycle Panel インジケーター Key Levels Market Structure, image 2
Trading product for Hurst Cycle Panel インジケーター Key Levels Market Structure, image 3
Trading product for Hurst Cycle Panel インジケーター Key Levels Market Structure, image 4
登録日 21/07/2025
1
販売

説明

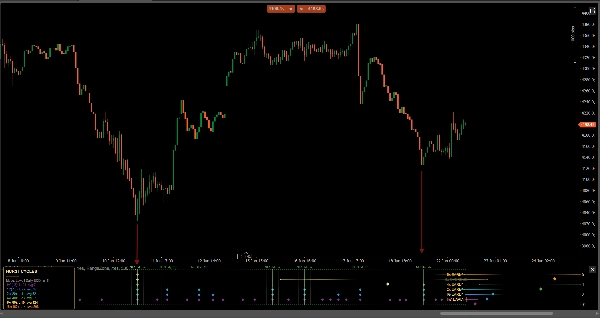
MTC Hurst Cycle Akademicaは、専用のサブペインで任意の市場のサイクル構造を階層ごとにマッピングします。J. M. Hurstのサイクル市場モデルに基づき、有効化された各サイクル階層の確定したサイクルトラフ(およびオプションでクレスト)を色分けされたダイヤモンドで示し、次に予想されるサイクルの底のタイミングを予測し、「Nest of Lows」— 複数のサイクルトラフが重なると予想されるバーを強調表示し、Hurstの古典的な高確率の転換コンテキストを示します。

主な特徴

• 7つのネストされたサイクル階層(HC、1C、2x、4x、8x、16x、32x)— 任意の組み合わせを有効化可能。

• 確定のみのダイヤモンド — 最新のマーカーはライブバー上で再描画されません。

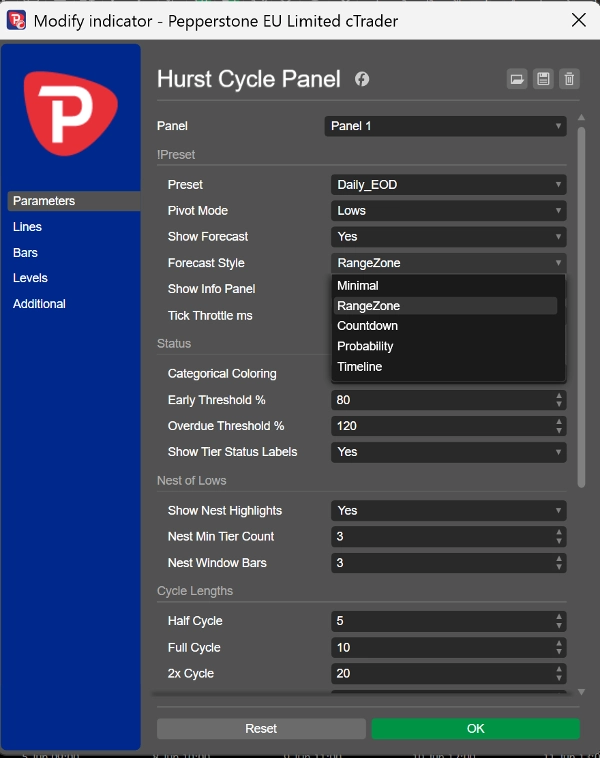
• 次のトラフ予測は5つの表示スタイル:ミニマル、レンジゾーン、カウントダウン、確率(1σ / 2σ)、タイムライン。

• 「Nest of Lows」のハイライトは、有効化されたサイクル長に自動的にスケール調整されます。

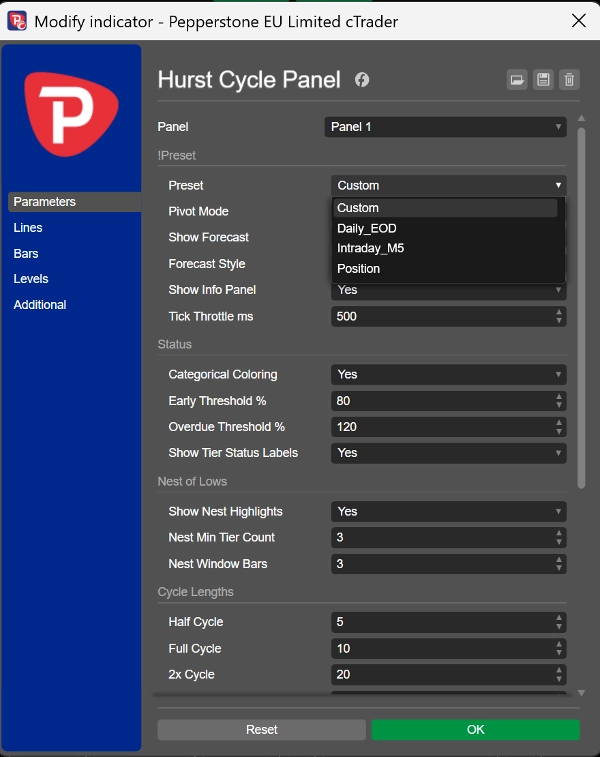
• ワンクリックプリセット:日次EOD、イントラデイM5、ポジション — または完全にカスタムのサイクル長。

• モダンなチャート上情報パネル:階層ごとのピボットカウント、測定された平均サイクル長(統計的に意味がある場合のみ表示)、およびハーモニック比のチェック。

• ピボットモード:ロー、ハイ、または両方。

• 自動調整スケール、クリーンでちらつきのないレンダリング。

使い方

価格チャートの下に追加してください。最も低いダイヤモンドと「Nest」のハイライトを市場のサイクルタイミングのバックボーンとして読み取り、予測を使って次の転換のタイミングウィンドウを予測します。これはMTC Hurst FLD Akademica(価格レベル)およびMTC Hurst Pulse Akademica(サイクル成熟度オシレーター)と自然に組み合わせて使用できます。

対応

任意のシンボルおよび任意の時間枠。

免責事項

これはJ. M. Hurstのサイクル市場理論に基づくテクニカル分析および可視化ツールです。注文を出すものではなく、パフォーマンス、精度、利益の保証はありません。サイクル分析は確率的であり、将来予測は推定であって予言ではありません。常に自身のリスク管理と判断を適用してください。過去の市場の動きは将来の結果を保証するものではありません。

概要

AIによる概要
The Hurst Cycle Panel is a technical analysis indicator that visualizes the cyclic structure of any market across multiple nested cycle tiers within a dedicated sub-pane below the price chart. Based on J. M. Hurst's cyclic market theory, it identifies and marks confirmed cycle troughs and optionally crests as color-coded diamonds, which do not repaint on the live bar. The indicator forecasts the timing of the next expected cycle low using five display styles: Minimal, Range Zone, Countdown, Probability (1σ / 2σ), and Timeline. It also highlights "Nest of Lows," bars where multiple cycle lows coincide, indicating high-probability turning points.

Key features include seven nested cycle tiers (HC, 1C, 2x, 4x, 8x, 16x, 32x) with customizable combinations, one-click presets for common timeframes (Daily EOD, Intraday M5, Position), and a modern on-chart info panel showing pivot counts, average cycle length, and harmonic-ratio checks. Users can select pivot modes (Lows, Highs, or Both) and benefit from auto-fitting scale and flicker-free rendering.

The panel works on any symbol and timeframe and is intended as a visualization tool to aid cycle timing analysis. It complements other Hurst-based tools for price levels and cycle maturity oscillation.

インジケーターのプロフィール
インジケーターのカテゴリー
モメンタム
出力の種類
ビジュアル表示
フィルター
シグナル
データ要件
バーのみ
ティックデータ
サポート対象のシグナル
反転

ディスカッション

カスタマーレビュー

0.0
レビュー: 0
カスタマーレビュー
この商品にはまだレビューがありません。お使いになったことがある方は、ぜひレビューをお願いします。

よくあるご質問

Key Levels
Market Structure
cTrader Storeで入手可能な取引ボット、インジケーター、プラグインなどの商品は、第三者の開発者が提供するものであり、情報と技術の取得のみを目的としてご利用いただけます。cTrader Storeはブローカーではなく、投資助言や個人的な推奨を行うことも、将来のパフォーマンスを保証することもありません。

この作成者の他の商品

インジケーター
ATR
EMA
+2
Dense EMA rainbow + Pro tools & a tested engine — get more from your EMAs, your research base for EMA bots.
インジケーター
Fibonacci
Key Levels
+1
Draw & learn Elliott, Harmonic, NeoWave manual plotting with built-in rule validator & coach.
インジケーター
Fibonacci
Key Levels
+4
Harmonic market structure across every scale, via Leibniz's Monadology — by David Murawski, der Mustermann.

これも好きかも

インジケーター
Drawdown Monitor
Protect your funded account. Real-time Daily Equity Drawdown monitor with Green / Orange / Red flashing alerts.
インジケーター
ZigZag
Indices
+2
Auto Trendlines, Fibonacci, Pitchfork and Patterns from non‑repainting pivots. One‑click Presets, targeted Alerts, and a
インジケーター
Auto-detect supply & demand zones, remove broken levels, and trade smarter with real-time alerts. Precision made simple.
インジケーター
Order Block
Breaker Block
+5
Unicorn Model ICT Indicator — Smart Trading with Precision
インジケーター
ATR
Prop
+14
Optimize exits with Chandelier Exit! Visualize stop-loss points dynamically for improved trading precision and safety.
インジケーター
[Hamster-Coder] Pivot Points (Multi Time Frame)
インジケーター
Signal
This Fair Value Gap (FVG) indicator is a technical analysis on multi-timeframe.
「Stochastic RSI PRO」ロゴ
トップ評価
4.6
(6)
$28
/
$40
インジケーター
RSI
Prop
+14
Unlock Stochastic RSI PRO in cTrader! Overlay RSI, highlight zones, and identify divergences with customizable settings.
インジケーター
📊 Smart Floating Risk Pro – Advanced Risk Management for cTrader
インジケーター
ATR
Wedge
+2
Strong Supertrend Turn Market Movement into a Clear Map Market analysis
インジケーター
Market Structure
Support & Resistance
Auto-centers price when it moves beyond threshold. Adjustable zoom. Works on any chart type. Never lose price again.
インジケーター
Forex
BTCUSD
+10
Trend-following channel using dual MAs with visual cloud and optional alerts on crossovers
インジケーター
Breakout
FlexSR auto‑detects pivot highs/lows to plot dynamic support & resistance lines Features customizable styling and option
インジケーター
MACD
Key Levels
+2
Trend indicator with multi-timeframe filters, generating signals only on fully completed bricks & candles. No Repaint.
インジケーター
Customize your Moving Average! Choose any timeframe and price source for precision and flexibility in your analysis.
インジケーター
Moving Average
An Indicator made for scalping. Shows you the Sniper movement on Chart with the colour signals.
インジケーター
ATR
BOS
+5
Opening ranges, dynamic trend channels, and multi-scale breakout/retest analysis for clear intraday chart decisions.
「FBX VWAP」ロゴ
トップ評価
4.5
(4)
$19
インジケーター
Prop
VWAP
+12
FBX VWAP Anchored — Professional VWAP

価格

登録日 21/07/2025
1
販売