present
Зарегистрируйтесь и получите скидку $50 на первую покупку
Trading product for CTraderPepperstoneDoctorChanIndicator Индикатор ADX EMA, image 1
CTraderPepperstoneDoctorChanIndicator
Индикатор
Версия 1.0, Aug 2026
Windows, Mac
Trading product for CTraderPepperstoneDoctorChanIndicator Индикатор ADX EMA, image 2
Trading product for CTraderPepperstoneDoctorChanIndicator Индикатор ADX EMA, image 3
Trading product for CTraderPepperstoneDoctorChanIndicator Индикатор ADX EMA, image 4
Trading product for CTraderPepperstoneDoctorChanIndicator Индикатор ADX EMA, image 5
Trading product for CTraderPepperstoneDoctorChanIndicator Индикатор ADX EMA, image 6
Trading product for CTraderPepperstoneDoctorChanIndicator Индикатор ADX EMA, image 7
Trading product for CTraderPepperstoneDoctorChanIndicator Индикатор ADX EMA, image 8
Trading product for CTraderPepperstoneDoctorChanIndicator Индикатор ADX EMA, image 9
Trading product for CTraderPepperstoneDoctorChanIndicator Индикатор ADX EMA, image 10
Trading product for CTraderPepperstoneDoctorChanIndicator Индикатор ADX EMA, image 11
С 10/08/2026

Описание

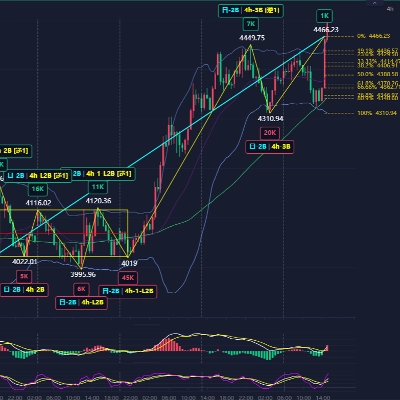
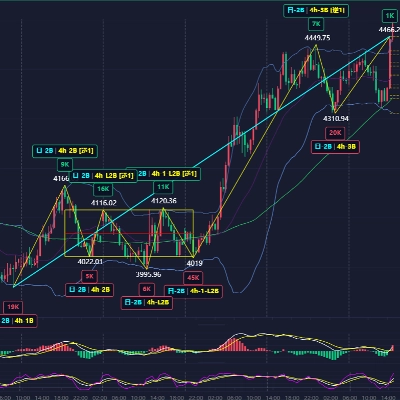
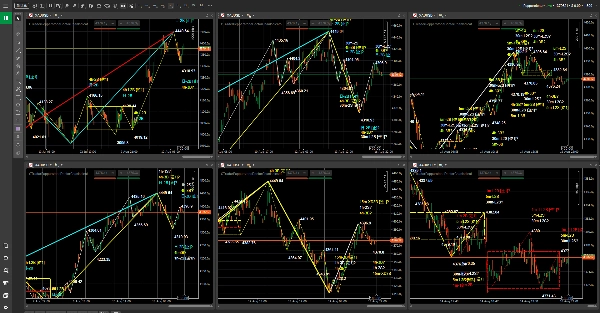
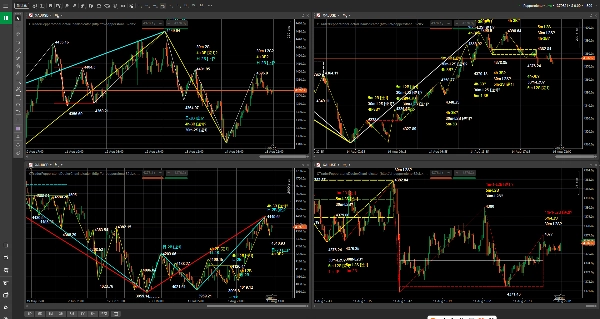
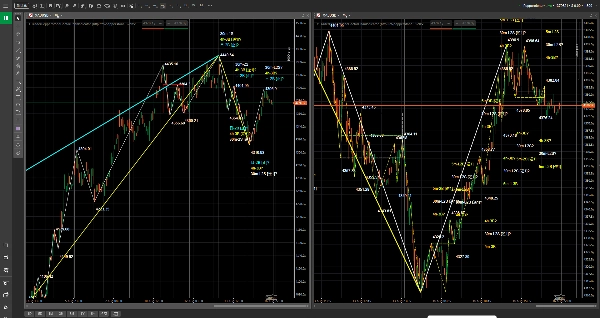
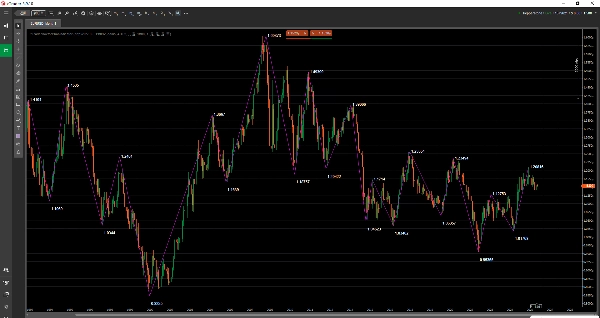
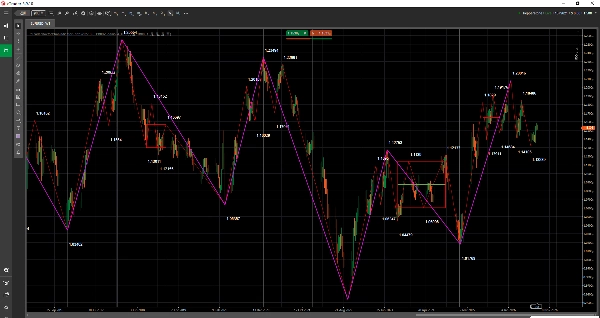
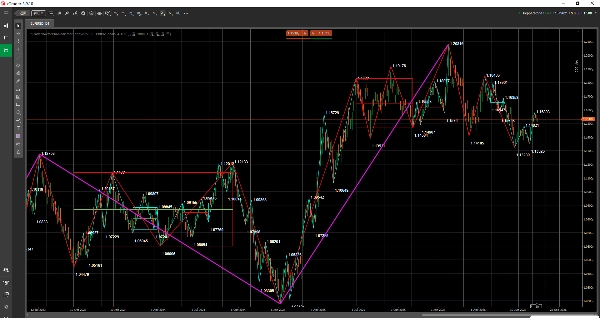
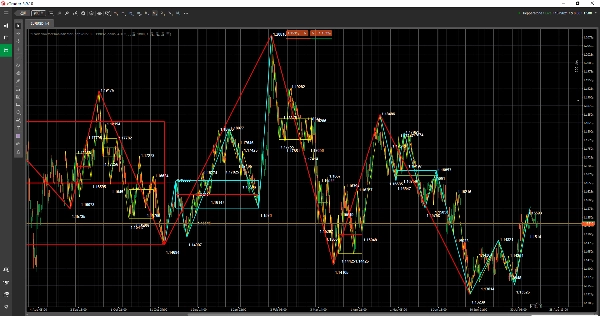
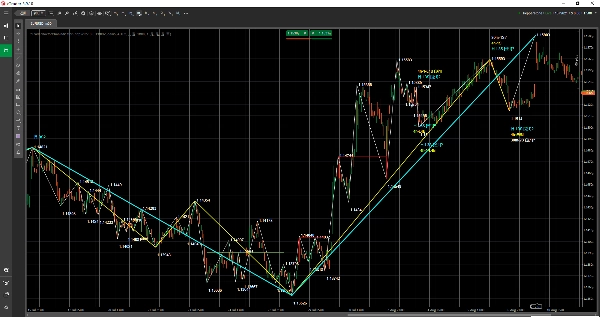
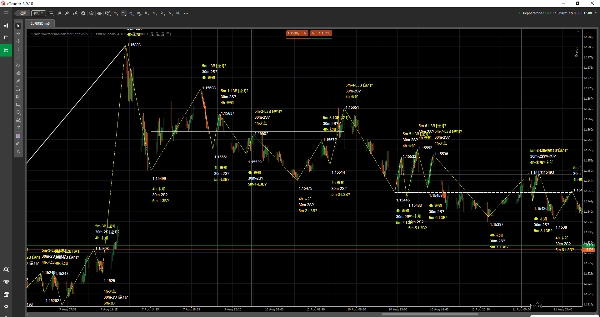
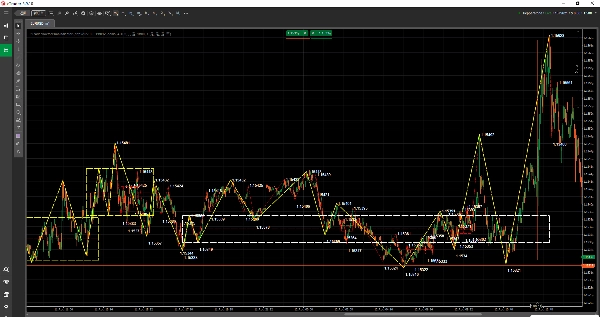
Dr Chan Theory Indicator for cTrader is a market structure / chart overlay technical analysis indicator used to display Dr Chan Theory structures on cTrader charts.


It is suitable for traders who focus on price action, trend structure and multi-timeframe analysis. The indicator displays key Dr Chan Theory structures as chart objects, including Bi structures, Zhongshu zones, buy/sell markers and more, helping users observe market rhythm, structural changes and relationships between different timeframes more intuitively.


This indicator is not an automated trading robot and is not a trading signal service. Its purpose is to help users read charts, review markets and build trading plans more clearly.


The current version is compatible with specified Pepperstone cTrader symbols and timeframes. This product is an independent third-party indicator and is not an official Pepperstone product or a Pepperstone partner product.


Indicator overview


- Indicator type: market structure / chart overlay indicator.

- Preferred instruments: specified Forex, indices, commodities, cryptocurrencies and stock CFD symbols in Pepperstone cTrader.

- Preferred timeframes: 1 minute, 5 minutes, 15 minutes, 30 minutes, 1 hour, 4 hours, daily, weekly and monthly.

- Trading use case: chart structure observation, multi-timeframe analysis, trading plan preparation and review support.


What you can see on the chart


- Bi structures: used to observe swing rhythm and structural progression.

- Zhongshu zones: used to observe important consolidation, balance and structural overlap areas.

- Buy/sell markers: used to help locate key structural reference points.

- Text labels, horizontal lines, vertical lines, rectangular areas, trend lines and other chart objects.

- Automatic data matching with the current chart timeframe is supported by default, making multi-timeframe observation easier.


Who this indicator is for


- Users who are learning or using Dr Chan Theory and Chan Theory structure analysis.

- Users who want to view structure information directly on cTrader charts.

- Users who use Pepperstone to view Forex, indices, commodities, cryptocurrencies or stock CFDs.

- Traders who need to compare trend structures across different timeframes.

- Users who want to make chart reading, planning and review workflows clearer.


Access and licensing


Product access and licensing are managed through the cTrader Store purchase, trial and installation process. Please refer to the purchase status, trial status and product information shown on the cTrader Store product page.


Currently supported Pepperstone symbols


Forex:

GBPUSD, EURUSD, USDJPY, USDCHF, AUDUSD, USDCAD, GBPJPY


Indices:

US500, NAS100, GER40, UK100, JPN225, VIX, HSTECH


Commodities:

XAUUSD, XAGUSD


Cryptocurrencies:

BTCUSD, ETHUSD


Stocks:

AAPL.US-24, MSFT.US-24, GOOG.US-24, AMZN.US-24, TSLA.US-24, NVDA.US-24, META.US-24, NFLX.US-24, JPM.US-24


Supported timeframes


1 minute, 5 minutes, 15 minutes, 30 minutes, 1 hour, 4 hours, daily, weekly and monthly.


Suggested workflow


1. Open a chart for a supported symbol in the Pepperstone cTrader environment.

2. Load Dr Chan Theory Indicator onto the chart.

3. The Dr Chan Theory Indicator data time is UTC+0. When checking chart structures, make sure to switch the cTrader chart time zone to the corresponding time zone before comparing positions.

4. Make sure the current chart timeframe is supported. The indicator automatically matches data to the chart timeframe.

5. Turn "Show Bi", "Show Zhongshu" and "Show Buy/Sell" on or off as needed.

6. Observe the chart structure together with your own trading plan, position management and risk control.


Parameter settings


The current version exposes only the following 3 visible parameters in the cTrader indicator panel. Data timeframe, broker symbol suffix, cache, refresh, compressed transfer and logging settings are managed internally by the indicator and do not need to be configured for normal use.


Show Bi


Default value: "true"


Whether to display Bi structures.


Show Zhongshu


Default value: "true"


Whether to display Zhongshu zones.


Show Buy/Sell


Default value: "true"


Whether to display buy/sell markers.


Important notes


- This product is a technical analysis assistant indicator, not an automated trading robot.

- The indicator does not place orders automatically.

- The indicator does not constitute investment advice, a trading signal service or a profit guarantee.

- The current version is compatible only with specified Pepperstone cTrader symbols and specified timeframes.

- The Dr Chan Theory Indicator data time is UTC+0. When displaying it on a cTrader chart, please switch to the corresponding chart time zone before checking structure positions.

- Users should use it together with their own trading plan, position management, risk control and independent judgment.


Future update direction


The current release version prioritizes specified Pepperstone cTrader symbols and timeframes. Future updates may continue to expand more brokers, more symbol mappings and a more complete data service scope according to the product plan.


Risk warning


Financial market trading involves risk. Past performance does not guarantee future results. This indicator is only a technical analysis and learning assistant tool. It does not constitute investment advice, a trading signal service or a profit guarantee. Historical structures do not represent future results. Users should fully test it in their own trading environment and use it carefully together with risk management rules.


Сводка

Профиль индикатора
Категория индикатора
Структура рынка (SMC)
Тип вывода
Визуализация
Требования к данным
Только бары
Внешние данные
Поддерживаемые сигналы
Расхождение
Сила тренда

Отзывы покупателей

0.0
Отзывы: 0
Отзывы покупателей
У этого продукта еще нет отзывов. Уже попробовали его? Поделитесь впечатлениями!

Обсуждение

Частые вопросы

ADX
EMA
Key Levels
Market Structure
MACD
Support & Resistance
Продукты, доступные в cTrader Store, включая торговых ботов, индикаторы и плагины, предоставляются сторонними разработчиками и доступны исключительно в информационных и технических целях. cTrader Store не является брокером и не предоставляет инвестиционные консультации, персональные рекомендации или какие-либо гарантии будущей доходности.

Вам также может понравиться

Индикатор
BTCUSD
EURUSD
+7
Pure Market Structure, Catching the Algo of Institutional move, Stay in the Game !! & know what's gonna happen Next.
Логотип продукта "Imperium MTF Heatmap"
Высокий рейтинг
4.5
(4)
Индикатор
AI
ATR
+27
Imperium MTF Heatmap is a unique top-tier indicator for cTrader, created for traders who want more than signals
Индикатор
AI
Prop
+16
Pro trading dashboard: WVAP analysis + Volume Profile + Neural AI tracking + News alerts. All-in-one tool!
Индикатор
Liquidity Grab
Liquidity Sweep
+2
Visualizes accumulation ranges, manipulation sweeps and distribution phases on your cTrader chart.
Логотип продукта "cAlgoBuddy - TDI Pro"
Высокий рейтинг
4.7
(4)
Индикатор
RSI
Forex
+10
All in One indicator designed to reveal Market Sentiment.
Индикатор
Imbalance
Risk Dashboard
+2
FX‑DESK RISK MANAGEMENT — Cross‑Asset Correlation Heatmap, Info Panel & Trade Signals
Индикатор
Supertrend
Premium visual market-regime indicator for cTrader. Works beautifully with BTC on the 1D timeframe.
Индикатор
ADX
ATR
+5
📊 3D ICT Order Blocks with ML probabilities, smart detection & bullish/bearish zones for precision trading setups now.
Индикатор
AI
ATR
+18
Advanced Level 2 market analysis tool.
Индикатор
Forex
Signal
+1
Great signal indicator, works with bollinger bands and heikin ashi candles! one of our latest innovations!
Индикатор
Prop
Forex
+13
"Footprint Chart: Visualize bid-ask volume inside candles for clearer order flow and market depth insights."
Индикатор
Forex
Renko scalping indicator
Индикатор
ADX
ATR
+5
Adaptive Fibonacci trailing system with regime detection, confidence grading, R:R zones and a live stats dashboard.
Индикатор
Prop
Forex
+15
Footprint volume indicator showing bid/ask splits at each price level
Индикатор
ADX
ATR
+3
Precision sniper-style confluence entries with graded signals, auto SL/TP & live backtest — 7 presets, MTF bias.
Индикатор
Forex
Signal
Literally the best Linear Regression Indicator out there. 8 distinct mathematical models and more!
Индикатор
VWAP
Fibonacci
+5
Market Blueprint - SMC/ICT One Indicator. Eleven Core Module, Single Chart , MTF candles, MTF FVG
Индикатор
Imbalance
Key Levels
+2
A Next-Generation Adaptive Oscillator with Z-Score Regime Engine.

Цена

С 10/08/2026