
설명
Trend Cycle은 단순한 방향뿐만 아니라 트렌드 지속 기간에 중점을 둔 트렌드 분석 도구입니다.
기능:
- Hull 이동평균선(HMA)의 기울기를 기반으로 강세 및 약세 트렌드를 감지합니다.
- 현재 트렌드가 활성화된 바의 수를 계산합니다 (실제 길이).
- 최근의 상승 트렌드와 하락 트렌드 길이를 별도로 저장합니다.
- 강세 및 약세 트렌드의 평균 길이를 계산합니다 (강세 평균 / 약세 평균).
- 다음을 그립니다:
-
- 강세 트렌드 동안의 녹색 HMA와 약세 트렌드 동안의 빨간 HMA.
- 각 트렌드 시작 시점에 수평 투영선과
PL: 18(예상 길이, 바 단위)와 같은 레이블. - 현재 가격 근처에 트렌드 방향과 실제 길이를 표시하는 실시간 레이블.
- 다음이 포함된 표시 패널:
-
- 강세 및 약세 트렌드의 평균 지속 기간,
- 최근 트렌드 길이 목록 (선택한 샘플 크기까지).
목표는 다음 질문에 답하는 데 도움을 주는 것입니다:
“이 트렌드는 얼마나 오래되었으며, 이런 트렌드는 보통 얼마나 지속되나요?”
작동 원리 (논리)
- Hull 이동평균선 (HMA)
지표는 닫는 가격의 Hull 이동평균을 HMA 평활 길이 매개변수를 사용해 계산합니다.
HMA는 단순 이동평균이나 EMA보다 부드럽지만 방향 변화에 빠르게 반응합니다. - 기울기에 의한 트렌드 감지
최근 트렌드 감지 민감도 바 동안 HMA를 확인합니다:
트렌드가 정의되는 동안 카운터(실제 길이)가 각 바마다 증가하며, 이는 현재 트렌드의 지속 기간을 나타냅니다. -
- HMA가 엄격히 상승했다면 → 트렌드는 강세 (↑)입니다.
- HMA가 엄격히 하락했다면 → 트렌드는 약세 (↓)입니다.
- 그렇지 않으면 이전 트렌드 상태를 유지합니다.
- 트렌드 길이 기록
트렌드가 강세에서 약세로 또는 그 반대로 전환될 때: -
- 완료된 트렌드의 지속 기간을 저장합니다:
-
- 강세 트렌드는 강세 목록에,
- 약세 트렌드는 약세 목록에 저장됩니다.
- 각 목록은 트렌드 샘플 크기(예: 최근 10개 트렌드)로 제한됩니다.
- 이 샘플들은 다음 계산에 사용됩니다:
-
- 강세 평균 = 평균 강세 트렌드 길이.
- 약세 평균 = 평균 약세 트렌드 길이.
- 예상 길이 투영
각 새로운 트렌드의 시작 시점에 충분한 샘플이 있으면:
이 투영선들은 차트에 기록으로 유지되어 예측된 트렌드 지속 기간과 실제 기간을 시각적으로 비교할 수 있습니다. -
- 해당 트렌드 유형(강세 또는 약세)의 평균 길이를 계산합니다.
- 트렌드 시작 바에서 약 그만큼의 바 길이로 수평선을 그립니다.
- 선 중앙에 레이블을 배치합니다:
-
PL: X→ 예상 길이 = X 바.
- 실시간 레이블
각 바마다 지표는 HMA 근처에 단일 실시간 레이블을 그립니다:
이 레이블은 현재 트렌드 방향과 지금까지 몇 개의 바가 지속되었는지를 정확히 보여줍니다. -
- 예시 텍스트:
-
Trend ↑
Real Len: 7
- 색상:
-
- 강세 트렌드는 녹색 (↑)
- 약세 트렌드는 주황색/빨간색 (↓)
- 표시 패널 (왼쪽 하단)
표시 패널 표시가 활성화되면, 차트 모서리에 고정 텍스트 패널이 나타나 다음을 보여줍니다:
이는 해당 심볼/타임프레임의 최근 트렌드 동향에 대한 빠른 통계 개요 역할을 합니다. -
- 제목: Trend Cycle
Bull avg: X barsBear avg: Y barsBull samples:최근 강세 트렌드 길이 목록Bear samples:최근 약세 트렌드 길이 목록
실전에서 읽는 방법
- 녹색 HMA + “Trend ↑”
→ 강세 트렌드가 활성화되어 있습니다.
→실제 길이는 지금까지 몇 개의 바가 지속되었는지 알려줍니다.
→ 가장 최근의PL: X선은 유사한 강세 트렌드가 보통 얼마나 지속되는지 시각적으로 보여줍니다. - 빨간 HMA + “Trend ↓”
→ 약세 트렌드가 활성화되어 있습니다.
→실제 길이= 현재 하락 추세의 기간.
→ 표시 패널에서 실제 길이와약세 평균을 비교하여 움직임이 초기인지 성숙한지 확인하세요. - 실제 길이가 평균에 근접하거나 초과할 때 (강세 평균 / 약세 평균):
→ 현재 트렌드는 최근 이력과 비교해 통계적으로 “오래된” 상태입니다.
→ 다음과 같은 선택을 할 수 있습니다: -
- 손절매를 조정하거나,
- 이익을 확정하거나,
- 해당 방향으로 새로운 진입에 더 신중해지기.
- 짧은 트렌드 vs 긴 트렌드
-
- 매우 짧은 트렌드가 많으면 → 변동성이 크고 평균 회귀적인 환경.
- 긴 트렌드가 적으면 → 더 방향성 있는 시장, 확장된 움직임.
요약
AI 요약
Trend Cycle is a technical indicator designed to analyze trend duration in financial markets. It detects bullish and bearish trends by evaluating the slope of a Hull Moving Average (HMA) applied to closing prices, providing a smoother yet responsive measure of trend direction. The indicator counts the number of bars the current trend has been active (Real Length) and records the lengths of recent up-trends and down-trends separately. Using these samples, it calculates average durations for bullish and bearish trends.
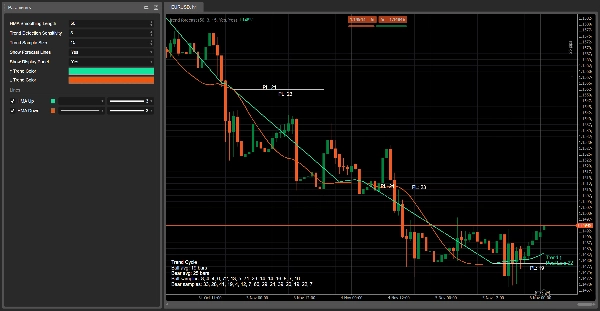
Visual elements include a green HMA line during bullish trends and a red HMA line during bearish trends. Horizontal projection lines mark the probable length of each trend at its start, labeled with "PL: X" to indicate expected duration in bars. A live label near the current price displays the active trend direction and its age in bars. An optional display panel offers a summary of average trend durations and recent trend length samples.
Trend Cycle helps users assess how long the current trend has lasted relative to historical trends, aiding decisions such as adjusting stops or managing entries. It supports analysis across various markets including Forex, cryptocurrencies, indices, commodities, and stocks.
지표 프로필
고객 리뷰
0.0
리뷰: 0
고객 리뷰
이 상품에 대한 리뷰가 아직 없습니다. 이미 사용해 보셨나요? 다른 사람들에게 가장 먼저 소개해 주세요!
상담
자주 묻는 질문(FAQ)
BTCUSD
Forex
Signal
Breakout
Indices
EURUSD
Commodities
GBPUSD
NZDUSD
Martingale
Bollinger
Prop
ZigZag
Scalping
Supertrend
Crypto
Grid
Stocks
AI
XAUUSD
NAS100
USDJPY
트레이딩 봇, 지표, 플러그인 등 cTrader Store에서 제공되는 상품은 제3자 개발자에 의해 제공되며, 이는 단순히 정보 및 기술적 접근을 목적으로 제공된 것입니다. cTrader Store는 중개인이 아니며, 투자 조언, 개인별 추천 또는 향후 성과에 대한 어떠한 보장도 제공하지 않습니다.


가격
42.11M
거래량
6.13M
핍 수익
230
판매
8.52K
무료 설치