설명
이 지표는 시장 구조의 변화와 주요 관심 영역을 식별하기 위해 가격 움직임 📈을 분석하는 데 기반합니다. 아래는 작동 방식에 대한 자세한 요약입니다:
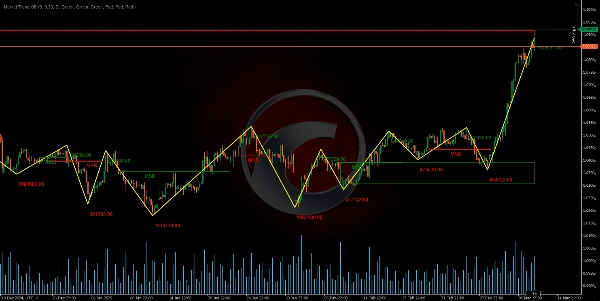
피벗 감지 및 지그재그 형성 🔄
특정 기간(길이 매개변수로 정의됨)을 분석하여 상대적인 고점과 저점을 식별합니다. 해당 구간 내 가격을 비교하여, 피벗 포인트 (변곡점)을 감지하며, 이는 다시 지그재그 패턴 ⚡을 형성합니다. 이 패턴은 가격 반전 이 발생하는 시점을 구분하는 데 도움을 줍니다.
거래량 누적 및 편차 계산 📊
피벗 감지 과정에서, 틱 거래량 이 평가 구간에 누적됩니다. 또한 피벗 가격 간의 백분율 차이를 계산하여 움직임이 충분히 중요한지 판단합니다. 이 편차는 정의된 임계값과 비교되어 구조 변화가 실제임 ✅을 확인하는 데 도움을 줍니다.
시장 구조 붕괴(MSB) 정의 🚨
지표는 마지막 두 피벗(고점 또는 저점 여부)을 평가하고, 되돌림 계수 (피보나치 수준에서 영감을 받음)을 적용하여 구조 붕괴 가 발생했는지 판단합니다.
- 이전 고점을 돌파한 후 가격이 더 낮은 저점을 생성하기 시작하면, 약세 구조 로 전환된 것으로 식별됩니다 🐻.
- 마찬가지로 이전 저점을 돌파한 후 가격이 더 높은 고점을 생성하면, 강세 구조 로 전환된 것으로 간주됩니다 🐂.
이 변화는 시장 구조 붕괴(MSB)로 해석됩니다.
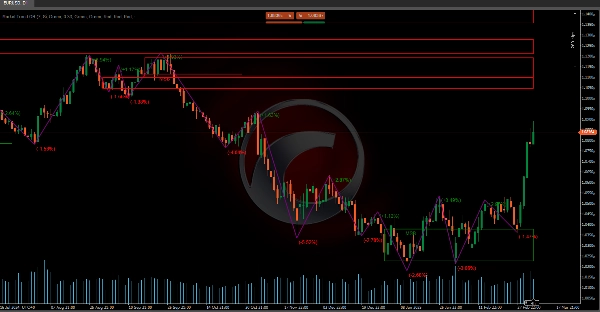
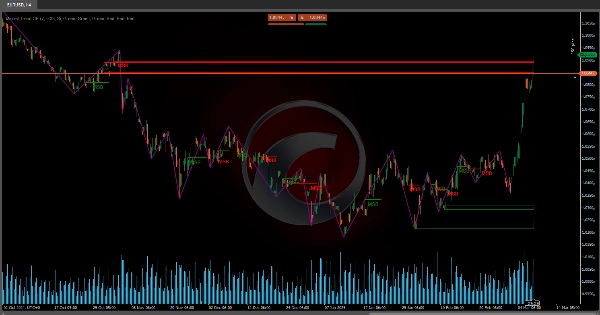
오더 블록 및 돌파 박스 식별 📦
MSB가 감지되면 이전 가격 움직임을 기반으로 중요한 구역이 정의됩니다:
- 오더 블록(OB) 🧱: 돌파 전에 마지막으로 중요한 움직임이 발생한 구역으로 식별됩니다. 약세 구조에서는 새로운 고점 전에 마지막 강세 캔들 이 사용되며, 강세 구조에서는 새로운 저점 전에 마지막 약세 캔들 이 사용됩니다.
- 돌파 박스(BB) 📈: 이들은 유사하게 결정되지만 가격이 이전 수준을 돌파했음을 확인하기 위해 추가 범위를 고려합니다.
이 구역들은 활동이 집중되는 영역을 정의하는 데 도움을 주며, 미래에 지지 또는 저항 역할을 할 수 있습니다.
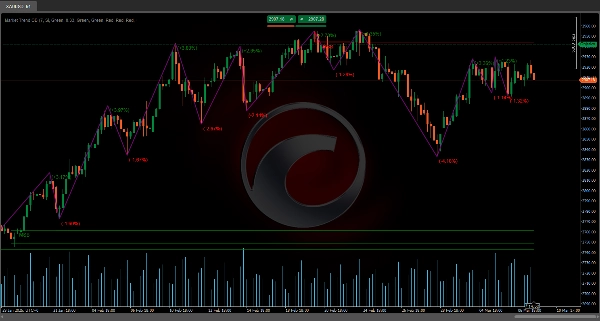
관련 지그재그 데이터 시각화 📊
피벗 시퀀스를 플로팅하는 것 외에도, 지표는 추가 데이터를 포함합니다:
- 반전 가격 💹: 추세 변화가 감지된 정확한 값이 기록됩니다.
- 반전 백분율 변화 🔄: 새 피벗 가격과 이전 피벗 가격 간의 백분율 변동이 계산되어 변화의 크기를 나타냅니다.
- 누적 거래량 📉: 피벗 형성으로 이어지는 구간 동안의 틱 거래량 합계가 표시됩니다.
이 데이터는 가정에 의존하지 않고 구체적인 계산에 기반하여 움직임의 강도와 중요성 을 평가할 수 있게 합니다.
요약하자면, 이 도구는 가격 움직임을 분석하여 시장이 추세를 변경하는 시점(MSB)을 감지하고, 거래 결정에 중요한 구역들(오더 블록 및 돌파 박스) 을 정의합니다 💼. 지그재그 패턴과 거래량 분석 및 백분율 편차 의 통합은 시장 구조에 대한 포괄적인 관점을 제공하며, 반전 지점 과 움직임의 강도 에 대한 정확한 정보를 제공합니다 💪.
Ctrader 스토어 지표:
요약
It defines Market Structure Breaks (MSB) by evaluating recent pivots with a retracement factor inspired by Fibonacci levels. A break in structure is signaled when price action shifts from higher highs to lower lows (bearish) or from lower lows to higher highs (bullish).
Upon detecting an MSB, the indicator identifies critical zones: Order Blocks (OB), representing the last significant candle before a breakout, and Breakout Boxes (BB), which confirm price level breaches with an additional range. These zones serve as potential future support or resistance areas.
The tool visualizes relevant zigzag data, including reversal prices, percentage changes, and accumulated volume, enabling assessment of movement strength and relevance based on concrete calculations. This comprehensive approach integrates zigzag patterns, volume analysis, and deviation metrics to provide precise information on reversal points and market movement strength, supporting informed trading decisions.
고객 리뷰
5 | 100 % | |
4 | 0 % | |
3 | 0 % | |
2 | 0 % | |
1 | 0 % |