
Pivot Points Clasic,FIBO,etc
Indicador
819 transferências
Versão 1.0, Jul 2025
Windows, Mac
Descrição
Pivot Points Customizável — O Indicador de Pivot Tudo-em-Um Definitivo para cTrader
Desbloqueie o poder da análise profissional de ação de preço com uma ferramenta versátil!
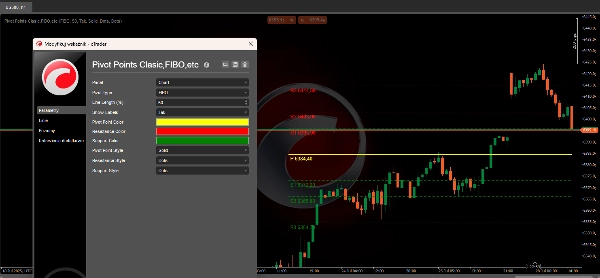
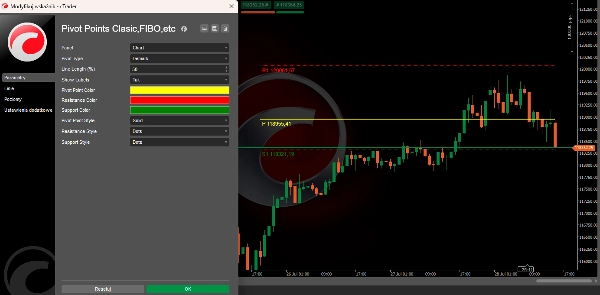
Pivot Points Customizável é um indicador avançado e altamente flexível para cTrader que coloca todos os principais métodos de cálculo de pivô ao seu alcance — oferecendo níveis claros de suporte/resistência, estilo personalizado e rotulagem inteligente no gráfico.
Principais Características:
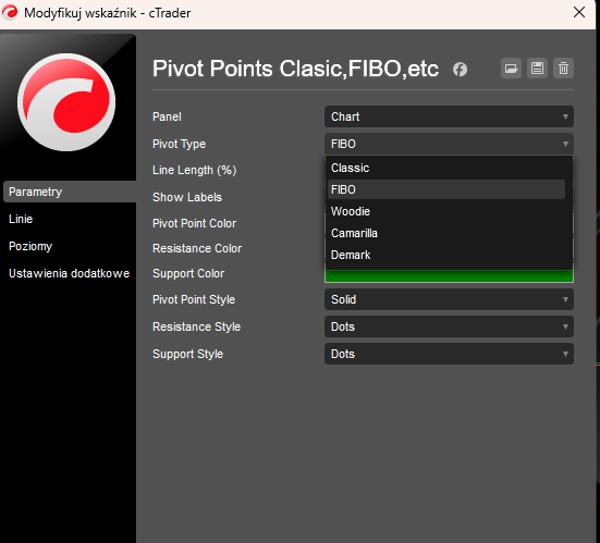
- 5 Métodos de Pivot em Um:
Alterne instantaneamente entre as fórmulas Clássica, Fibonacci, Woodie, Camarilla e Demark. Perfeito para todos os estilos de negociação: scalping, day trading e swing trading. - Personalização Completa:
-
- Escolha seu método de cálculo de pivô.
- Defina cores e estilos de linha personalizados para níveis de pivô, resistência e suporte.
- Ajuste o comprimento da linha visível como uma porcentagem do seu gráfico para visuais limpos e sem desordem.
- Ative/desative rótulos inteligentes que mostram níveis de preço em tempo real para cada pivô.
- Sobreposição Profissional no Gráfico:
Desenha pivôs e níveis de S/R diretamente no seu gráfico de preços, atualizando automaticamente conforme novas barras aparecem.
Níveis suportados para cada método: -
- Clássico, Fibo, Woodie: Até 3–4 resistências (R1–R4) e suportes (S1–S4)
- Camarilla: Até 4 resistências e suportes
- Demark: Níveis únicos personalizados (apenas R1, S1 e Pivot)
- Rápido e Leve:
Otimizado para desempenho em tempo real — sem atrasos, sem bibliotecas externas, código 100% nativo cTrader. - Ideal para Todos os Mercados:
Funciona perfeitamente com Forex, índices, commodities, criptomoedas e mais!
Por que escolher o Pivot Points Customizável?
- Múltiplas estratégias, uma ferramenta: Altere pivôs com um clique — teste qual se adapta ao seu mercado!
- Identifique níveis-chave rapidamente:
Acesso imediato a zonas onde reversões ou rompimentos de preço são mais prováveis. - Clareza máxima no gráfico:
Linhas se ajustam automaticamente à janela do gráfico — nada mais de indicadores sobrepostos ou desordenados. - Aumente sua confiança na negociação:
Saiba onde instituições e profissionais observam o preço em cada sessão.
Tome decisões de negociação melhores hoje. Experimente o Pivot Points Customizável — e veja a diferença na sua análise técnica!
Resumo
Resumo de IA
Pivot Points Customizable is a versatile indicator designed for the cTrader platform that integrates five major pivot point calculation methods: Classic, Fibonacci, Woodie, Camarilla, and Demark. It provides traders with clear support and resistance levels directly overlaid on price charts, updating automatically as new bars form. Users can fully customize the indicator by selecting pivot calculation methods, adjusting colors and line styles for pivot, resistance, and support levels, and setting line lengths relative to the chart window to maintain visual clarity. Smart labels displaying real-time price levels for each pivot can be toggled on or off. The indicator supports multiple resistance and support levels depending on the method chosen—up to four for Classic, Fibonacci, Woodie, and Camarilla, and unique levels for Demark. Optimized for real-time performance with native cTrader code, it operates without lag or external dependencies. This tool is suitable for various trading styles including scalping, day trading, and swing trading, and is compatible with multiple markets such as Forex, indices, commodities, and cryptocurrencies. It aims to assist traders in identifying key price levels where reversals or breakouts are likely, enhancing technical analysis and decision-making.
Perfil do indicador
Avaliações de clientes
0.0
Avaliações: 0
Avaliações de clientes
Ainda não há avaliações para este produto. Já o experimentou? Seja o primeiro a contar a outras pessoas!
Conversa
Perguntas frequentes
Os produtos disponíveis através da cTrader Store, incluindo bots de negociação, indicadores e plugins, são fornecidos por programadores terceiros e são disponibilizados apenas para fins informativos e de acesso técnico. A cTrader Store não é um corretor e não fornece aconselhamento em matéria de investimento, recomendações pessoais ou qualquer garantia de desempenho no futuro.


Preço
Desde 26/06/2025
59.07M
Volume negociado
965.98K
Pips ganhos
819
Instalações gratuitas